AnalytiX Dashboard
Unlock the true potential of your data with AnalytiX Dashboard, an edge-cutting odoo dashboard
module designed to
revolutionize the way you visualize & analyze information. Elevate
your decision-making process with intuitive, interactive,
& insightful dashboards that
empower you to confidently navigate your business landscape.
Real-time update without setting time intervals.
Shareable dashboard link and embed link.
Embed base module view in the dashboard.
Import/Export dashboard & dashboard items.
Preset 10+ color themes with Odoo default theme.
Advance date filter.
Retrive data by SQL query.
Option to create a custom filter.
Streamline access control.
Trend chart with stats values of selected entities.
Attractive and fully responsive layout.
Embed Dashboard link on other websites.
Move & copy dashboard items.
Set the dashboard as main menu.
Easy measure data format option
Editable dashboard layout.
Download dashboard to PDF with items
RTL support
Configuring correct access rights in Odoo is quite technical and lengthy process for someone who has little experience with the system and can get messy if you are not sure what you are doing. This module helps you to avoid all these complexities and saves your precious time by providing you a user-friendly interface from where you can define all the access settings to specific users in one place.
- No technical knowledge needed.
- Work in both Odoo Community and Enterprise addons.
Configuring correct access rights in Odoo is quite technical and lengthy process for someone who has little experience with the system and can get messy if you are not sure what you are doing. This module helps you to avoid all these complexities and saves your precious time by providing you a user-friendly interface from where you can define all the access settings to specific users in one place.
- Also the app allows you to create user-wise access management so that you can add/remove users to and from any group(s) in batch and with much ease without any coding in very less time. And this works with all the base and 3rd party apps.
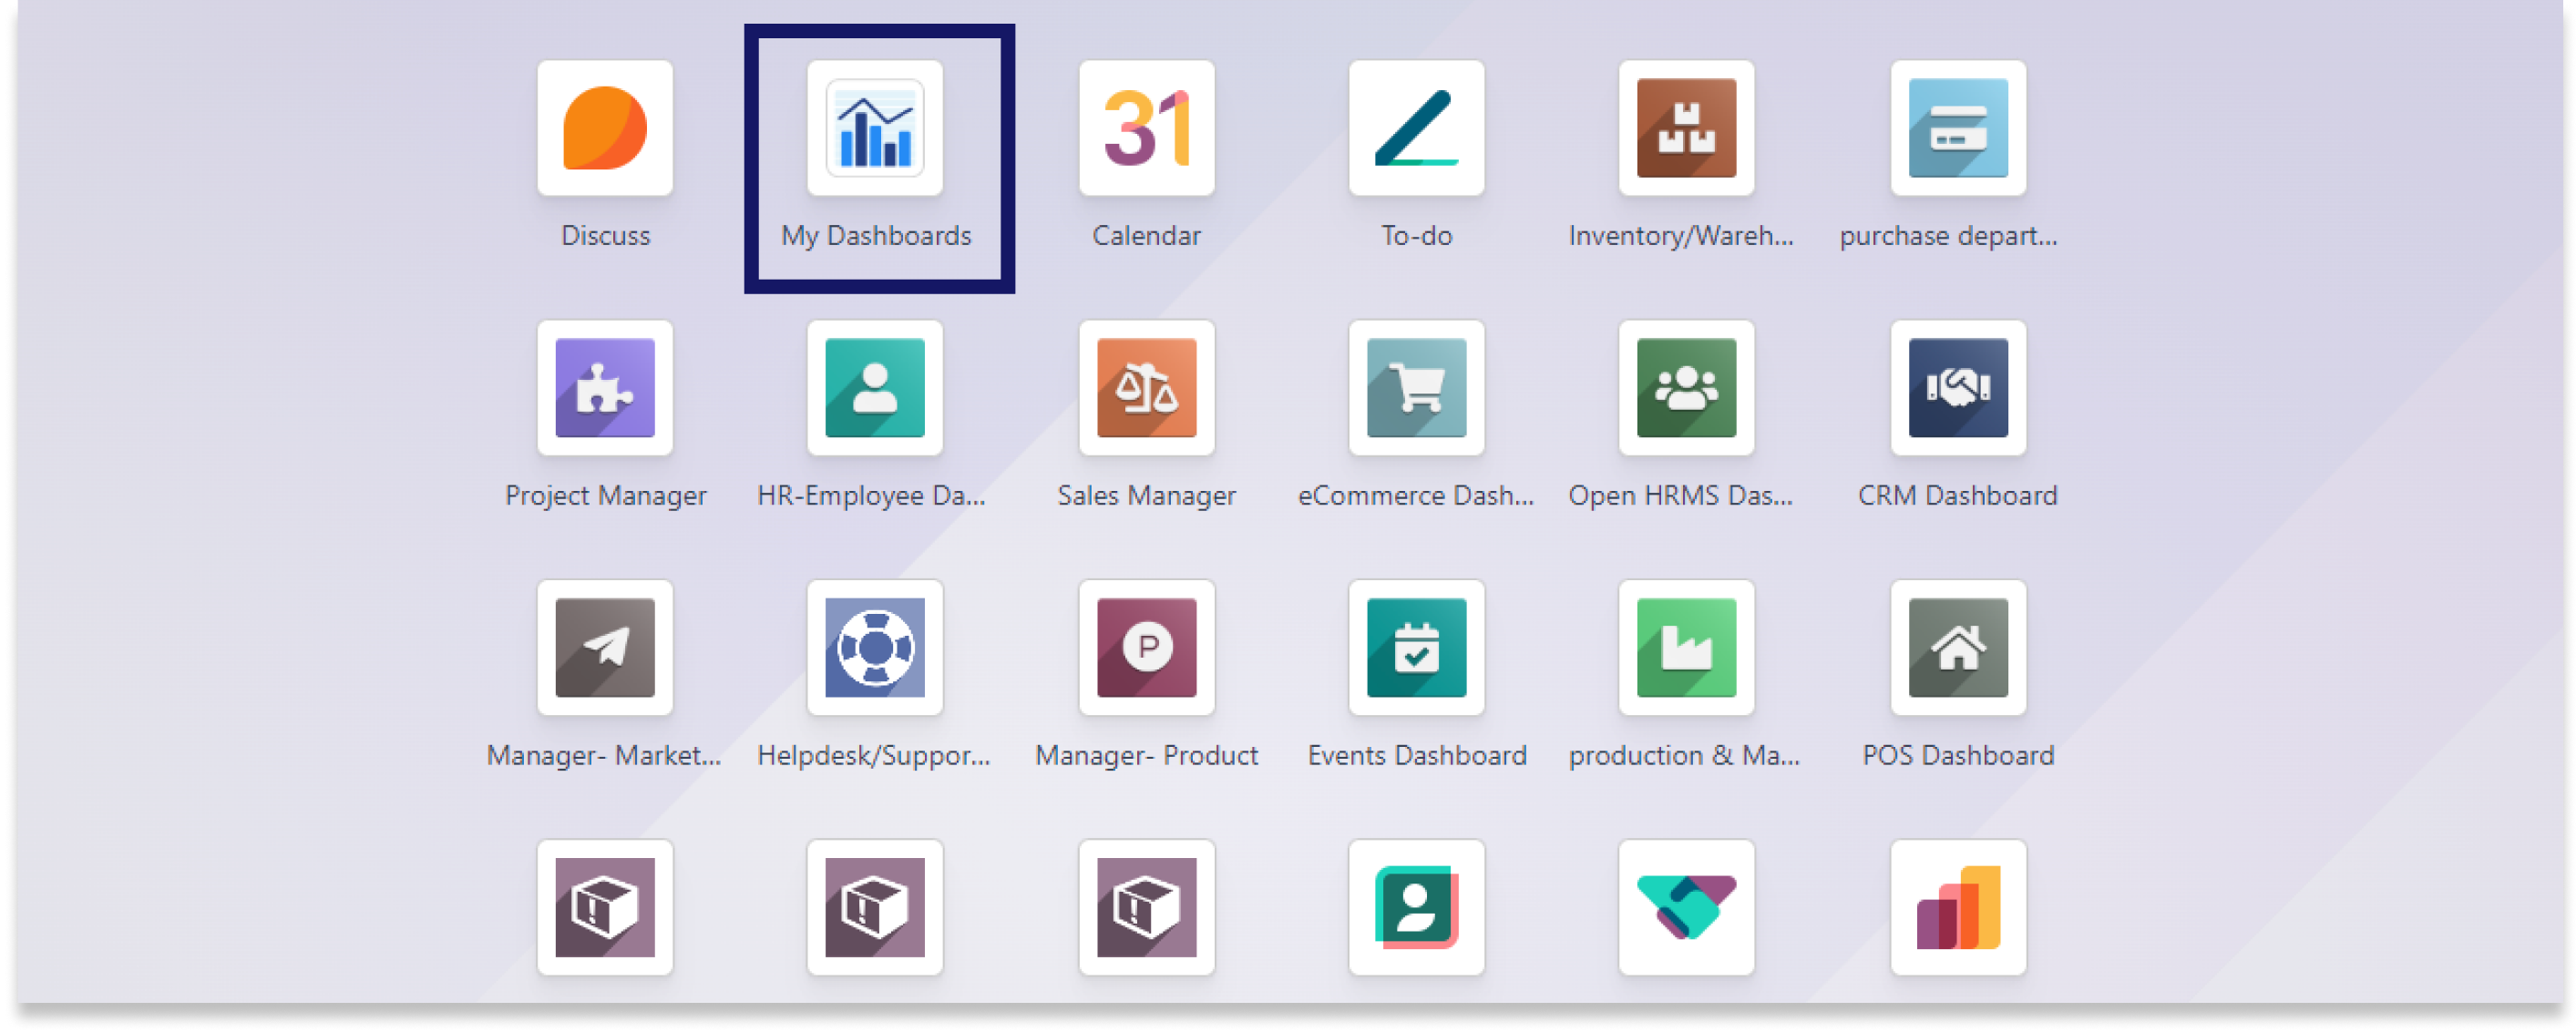
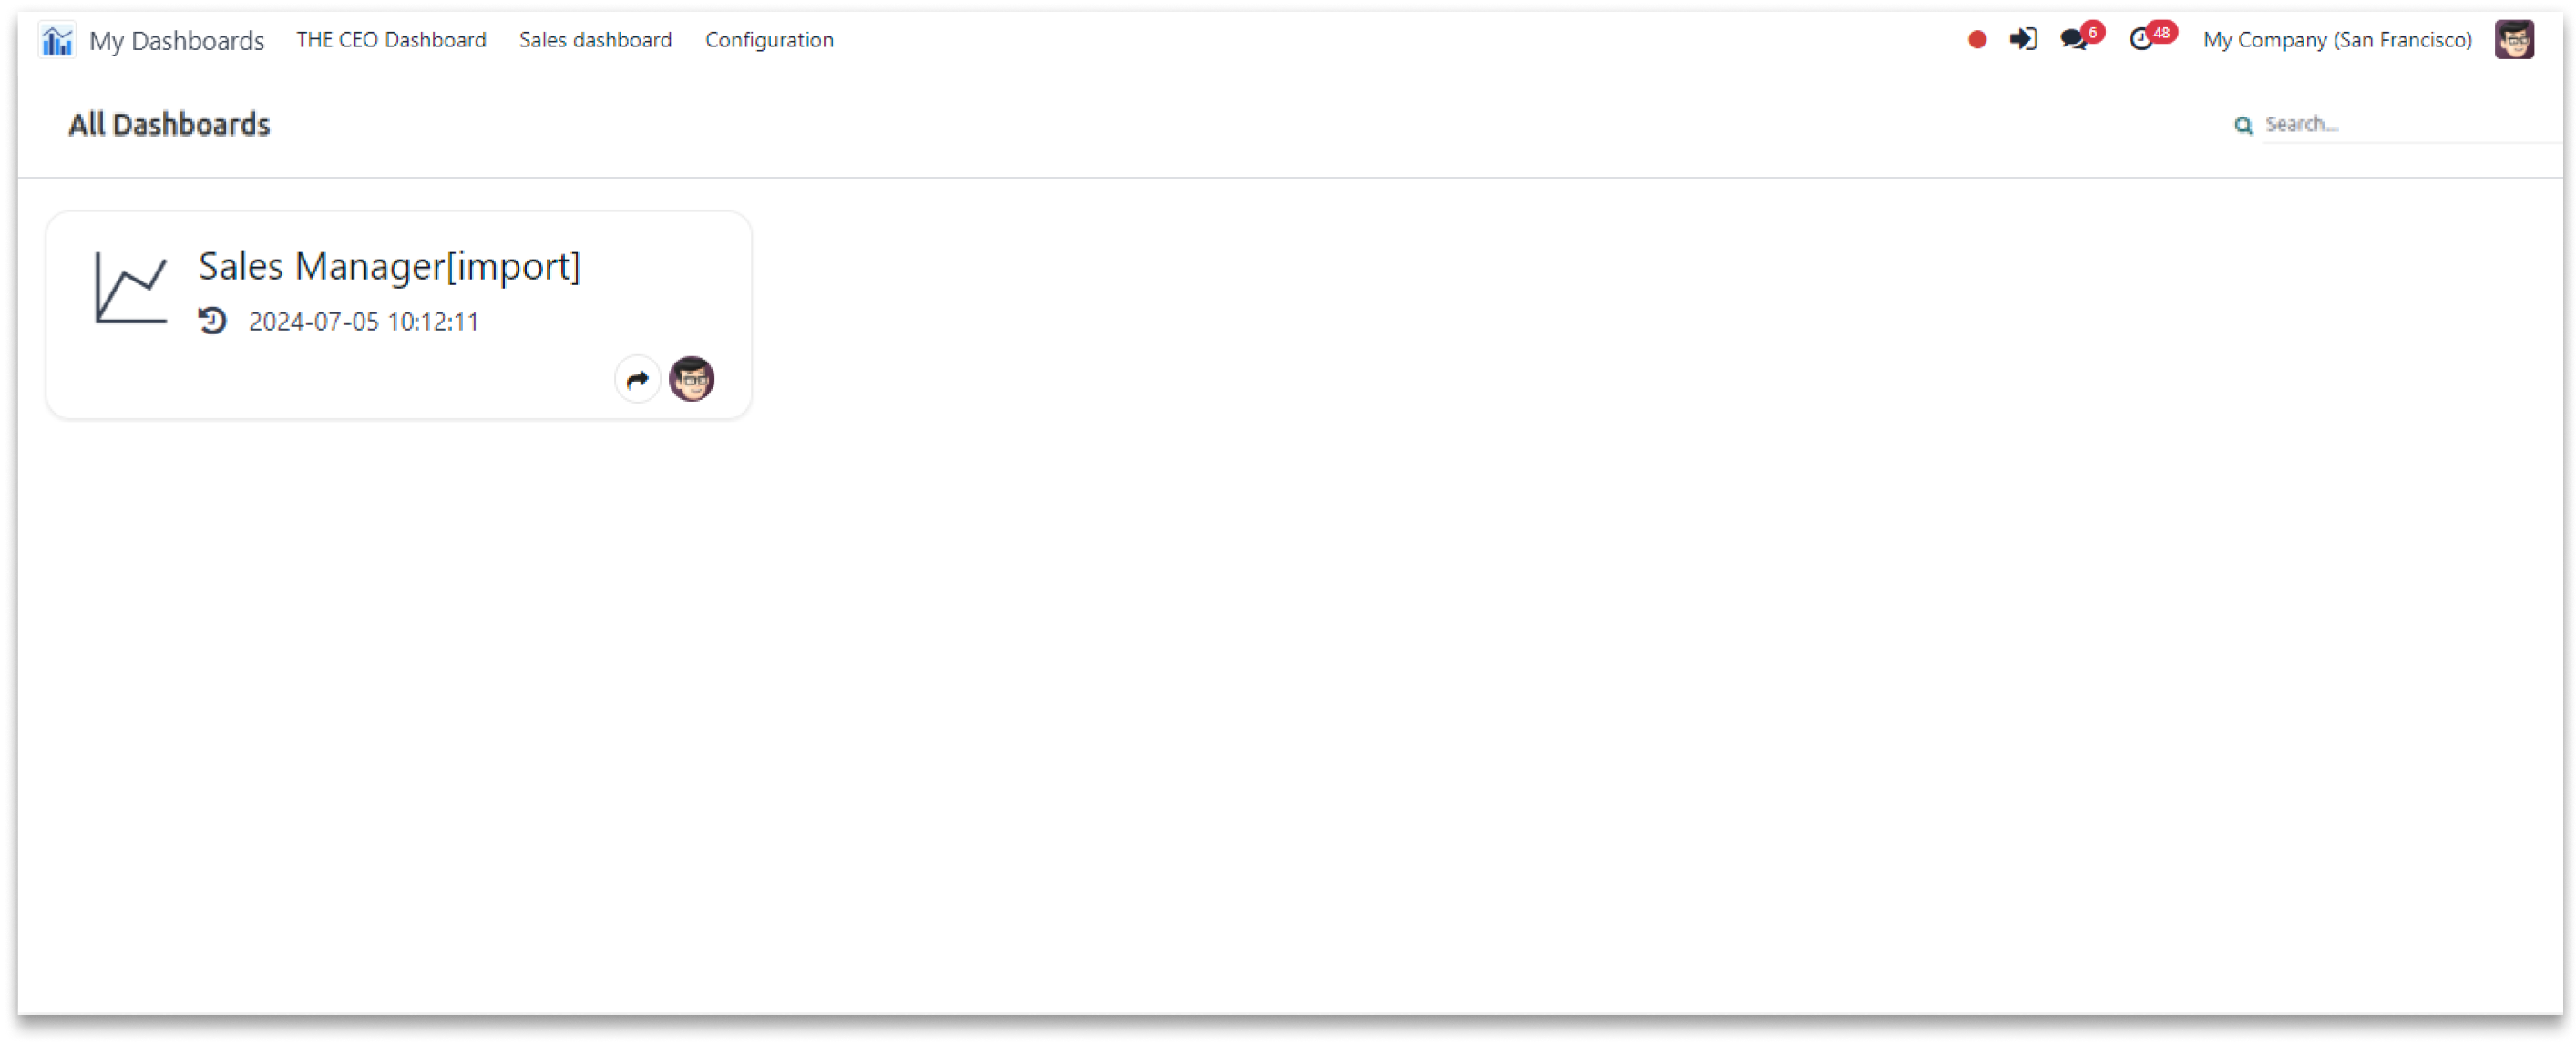
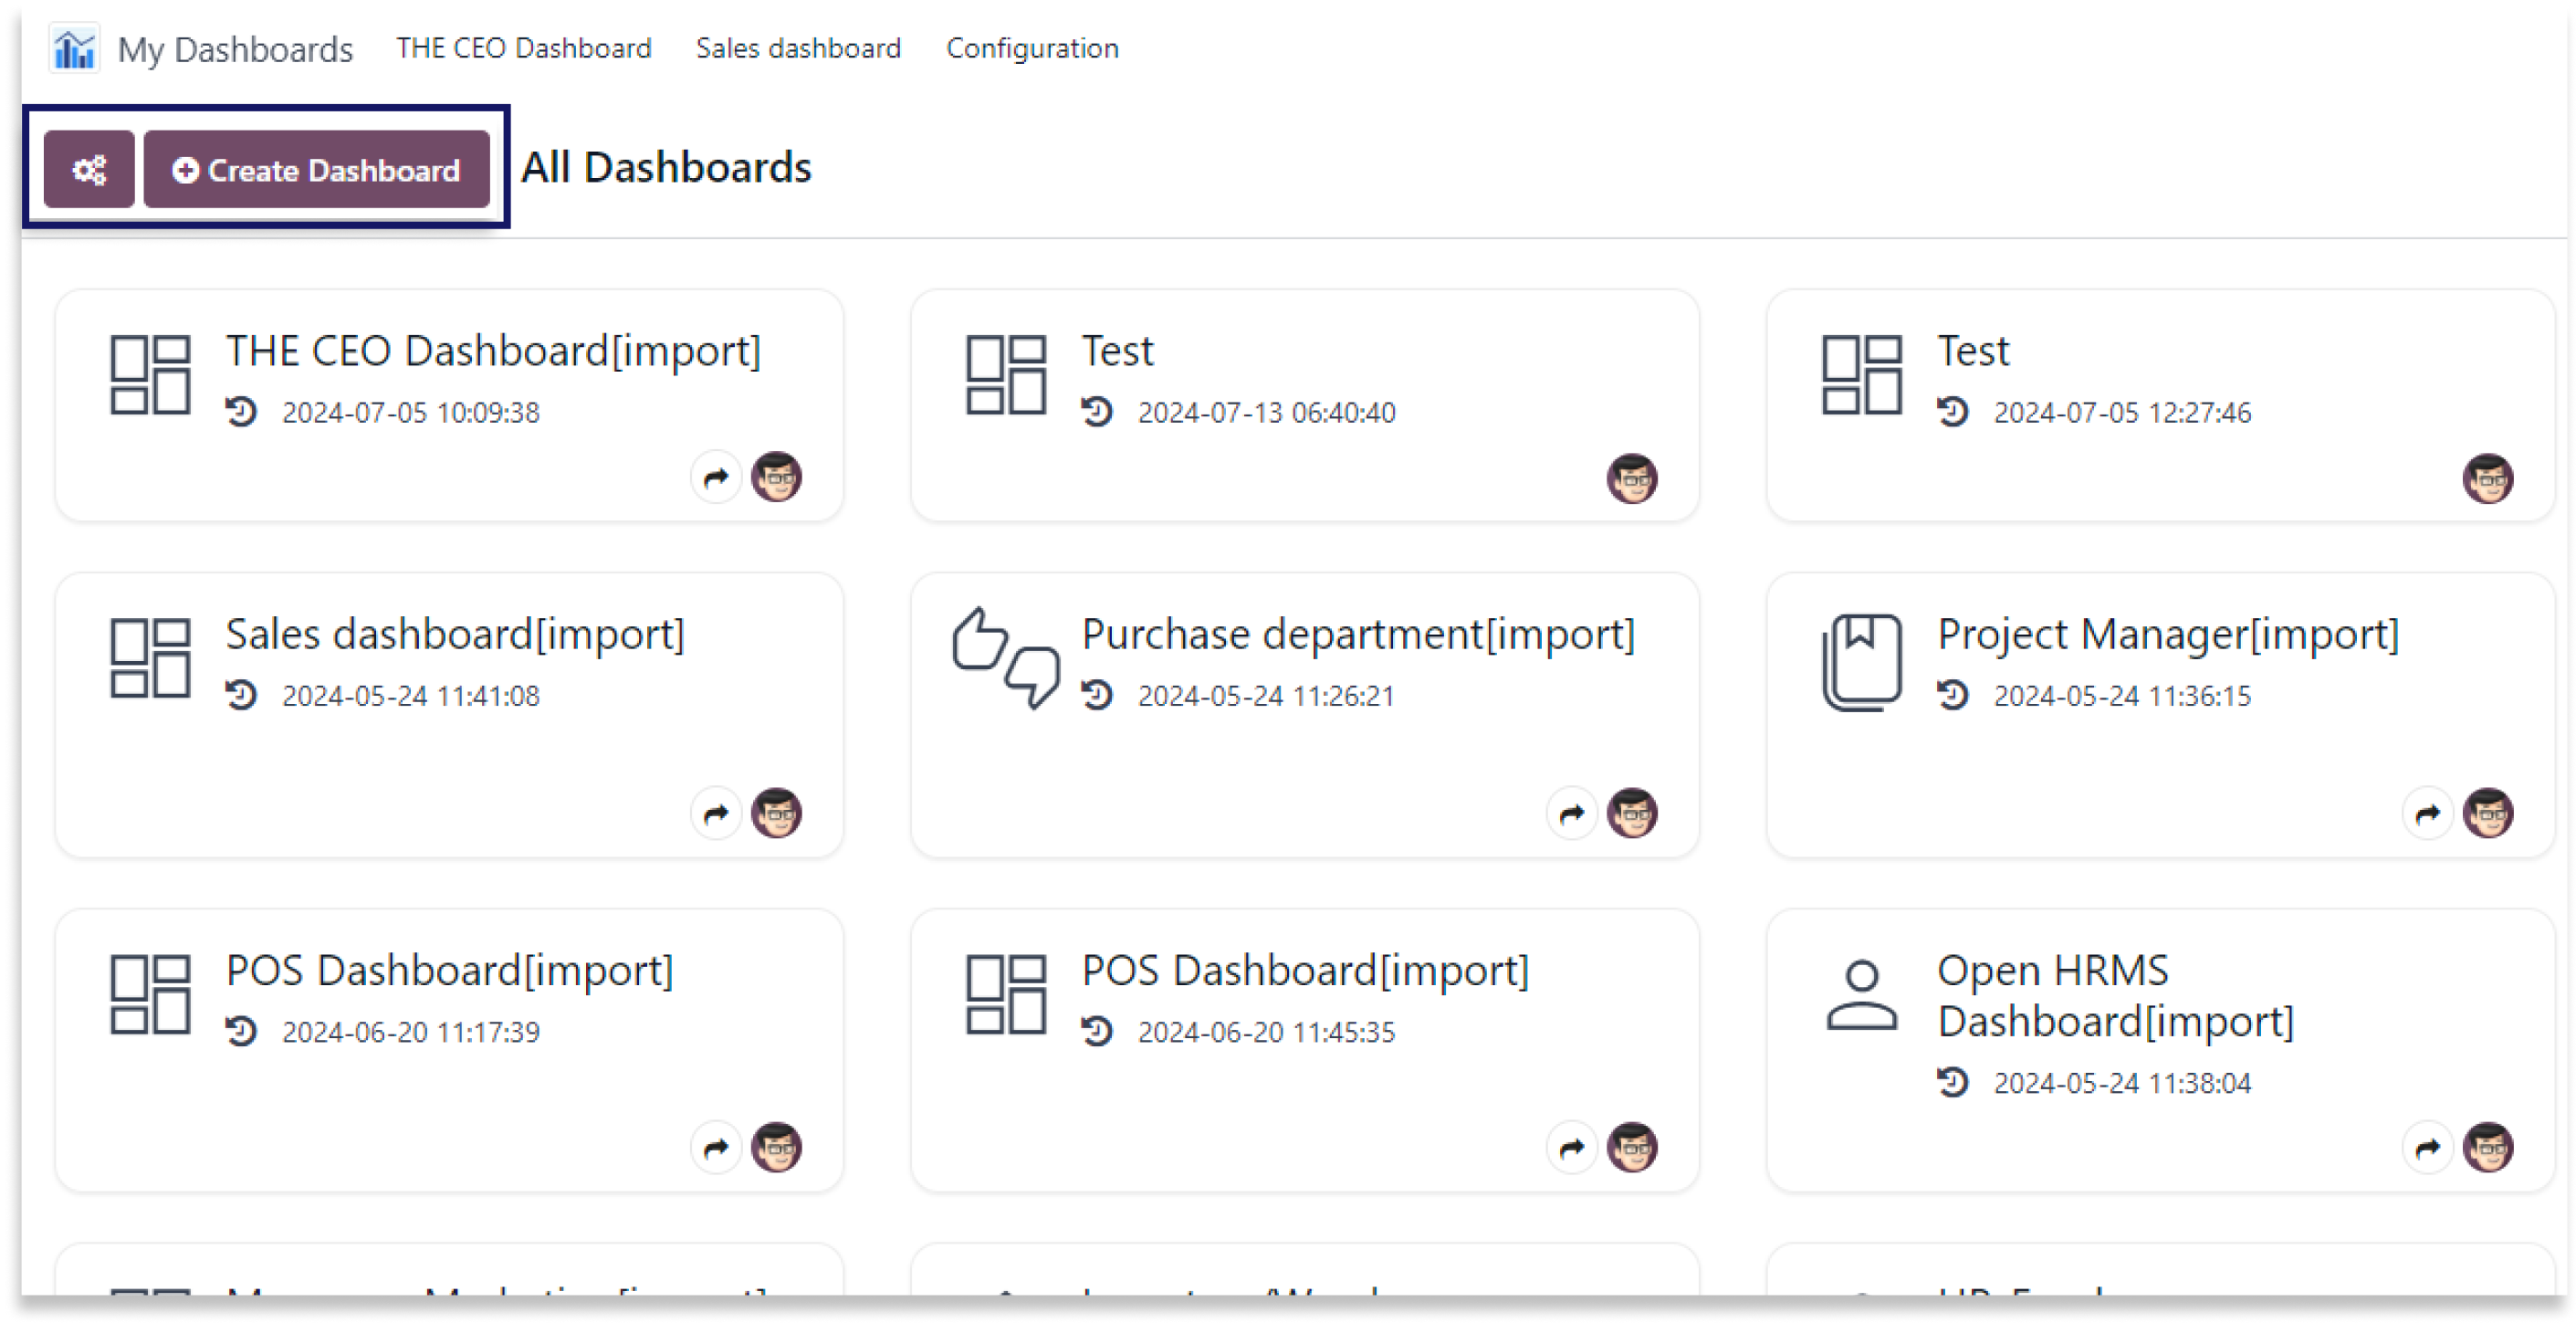
Here is a detailed explanation about all the features of this module.
Module setup and fields explanation.
Click on the image to zoom in.
Click on the image to zoom in.
Click on the image to zoom in.
Click on the image to zoom in.
Click on the image to zoom in.
Real-Time update without setting time intervals.
You must have technical knowledge.
You have to need Odoo enterprise addons.
Here is the solution
No need to have technical knowledge, Only you have to understand our module features and you will be rock.
Work in both Enterprise and Community versions(15,16,17).
Real-time update dashboard
Here we have explained an example step by step.
This example shows how AnalytiX Dashboard auto-refreshes data at regular intervals.
-
Say goodbye to manual refreshes as 'AnalytiX Dashboard' seamlessly updates your dashboard at regular intervals.
-
Stay ahead of the curve with the latest insights, enabling swift decision-making and ensuring that your data is always current.
-
Double click on the video to zoom in.
Simple steps to share or copy dashboard through dashboard link.
You must have technical knowledge/technical person.
You have to need Odoo enterprise addons.
Here is the solution
No need to have technical knowledge, Only you have to understand our module features and you will be rock.
Work in both Enterprise and Community versions(15,16,17).
Shareable dashboard link.
Here we have explained an example step by step.
This example shows how you can easily share and copy dashboard in just a few clicks.
-
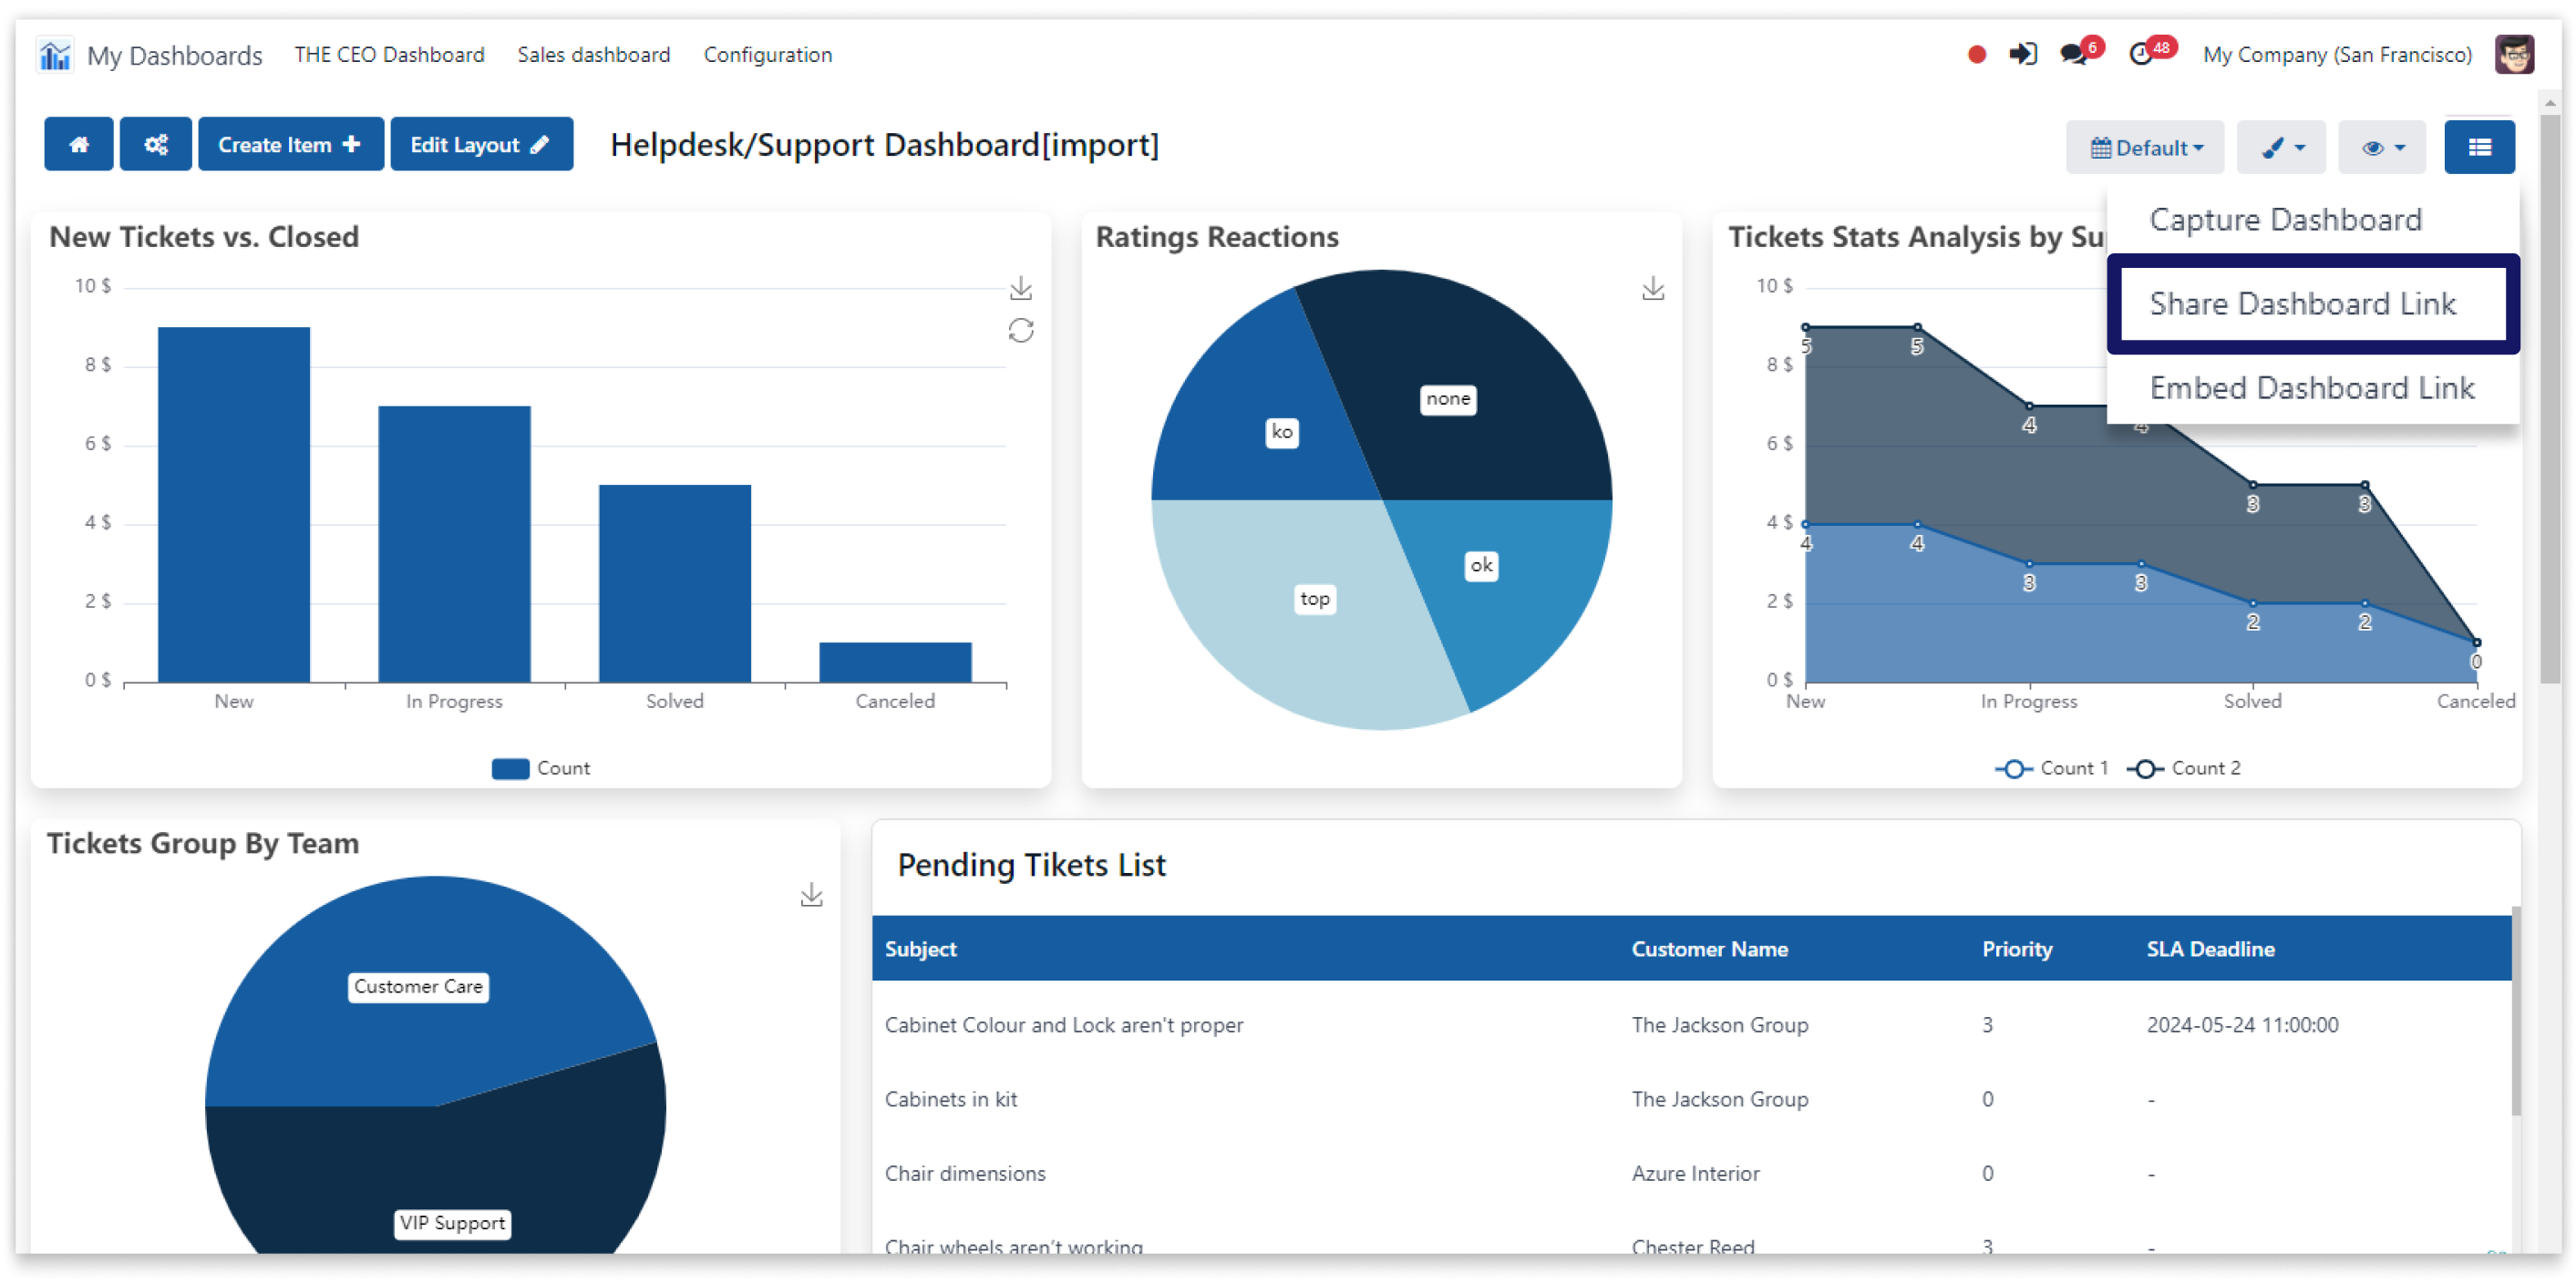
To share a dashboard link, simply copy the URL from your dashboard sharing option and distribute it to your intended recipients.
-
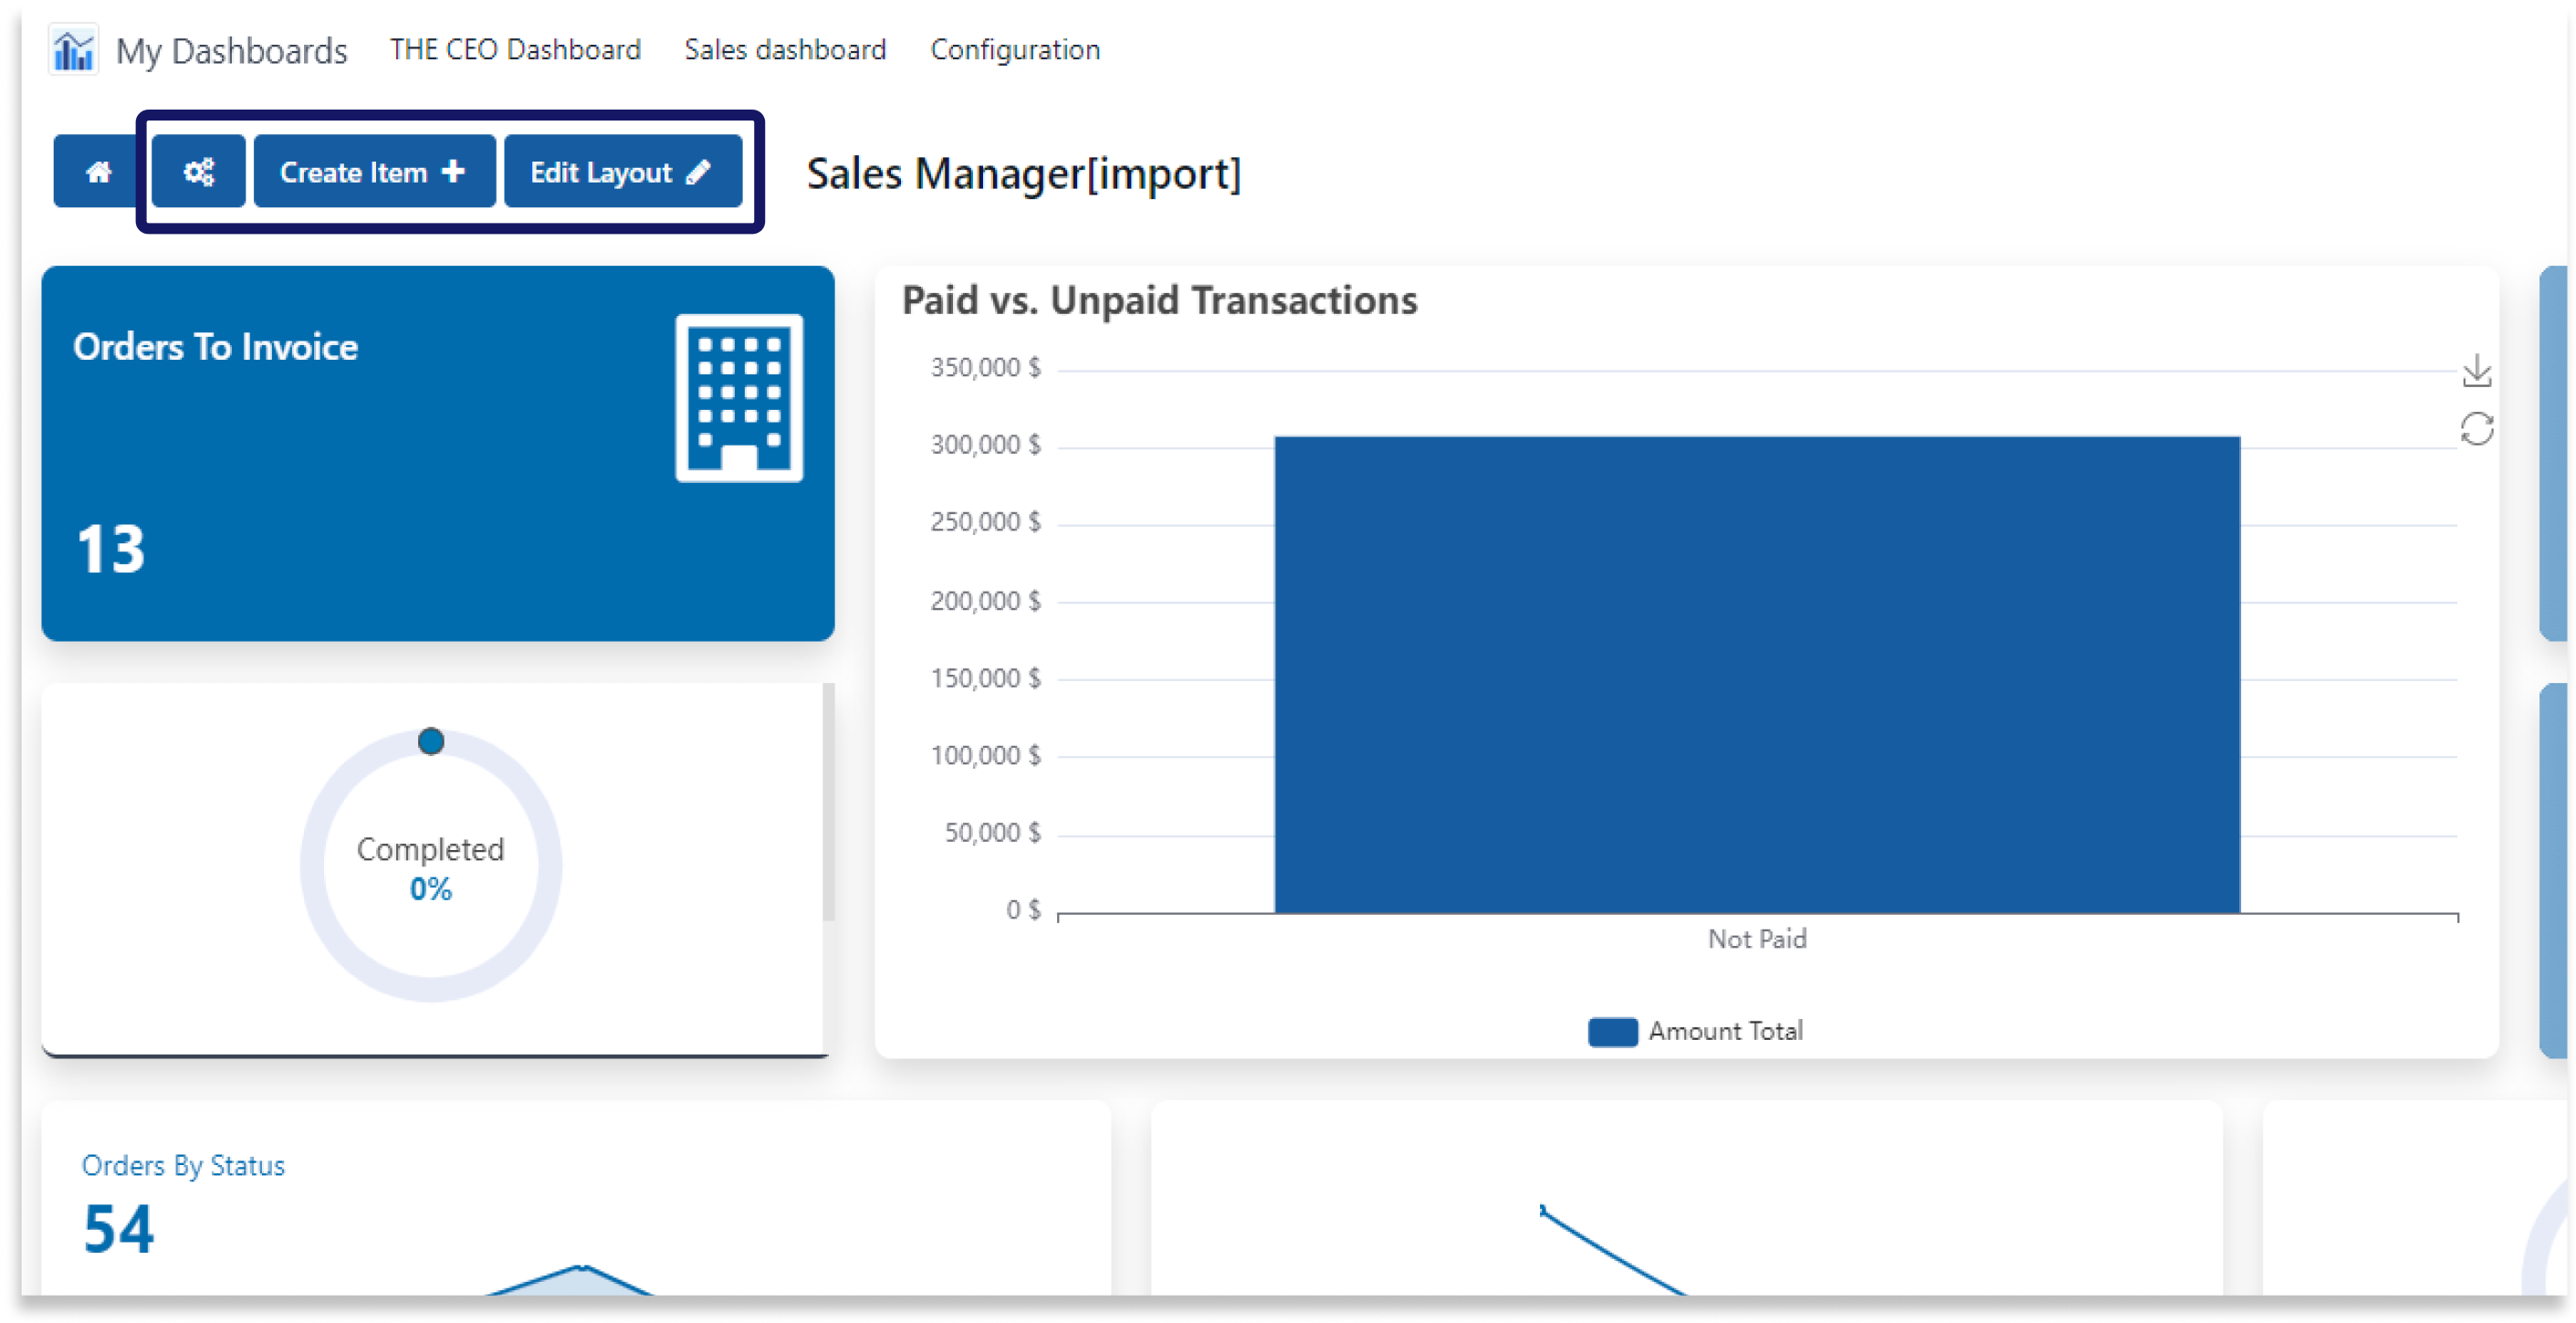
To duplicate the same dashboard, use the Share Dashboard link feature found in your dashboard’s side menu.
-
Just click on the share dashboard link and copy the link.
-
Click on the image to zoom in.
-
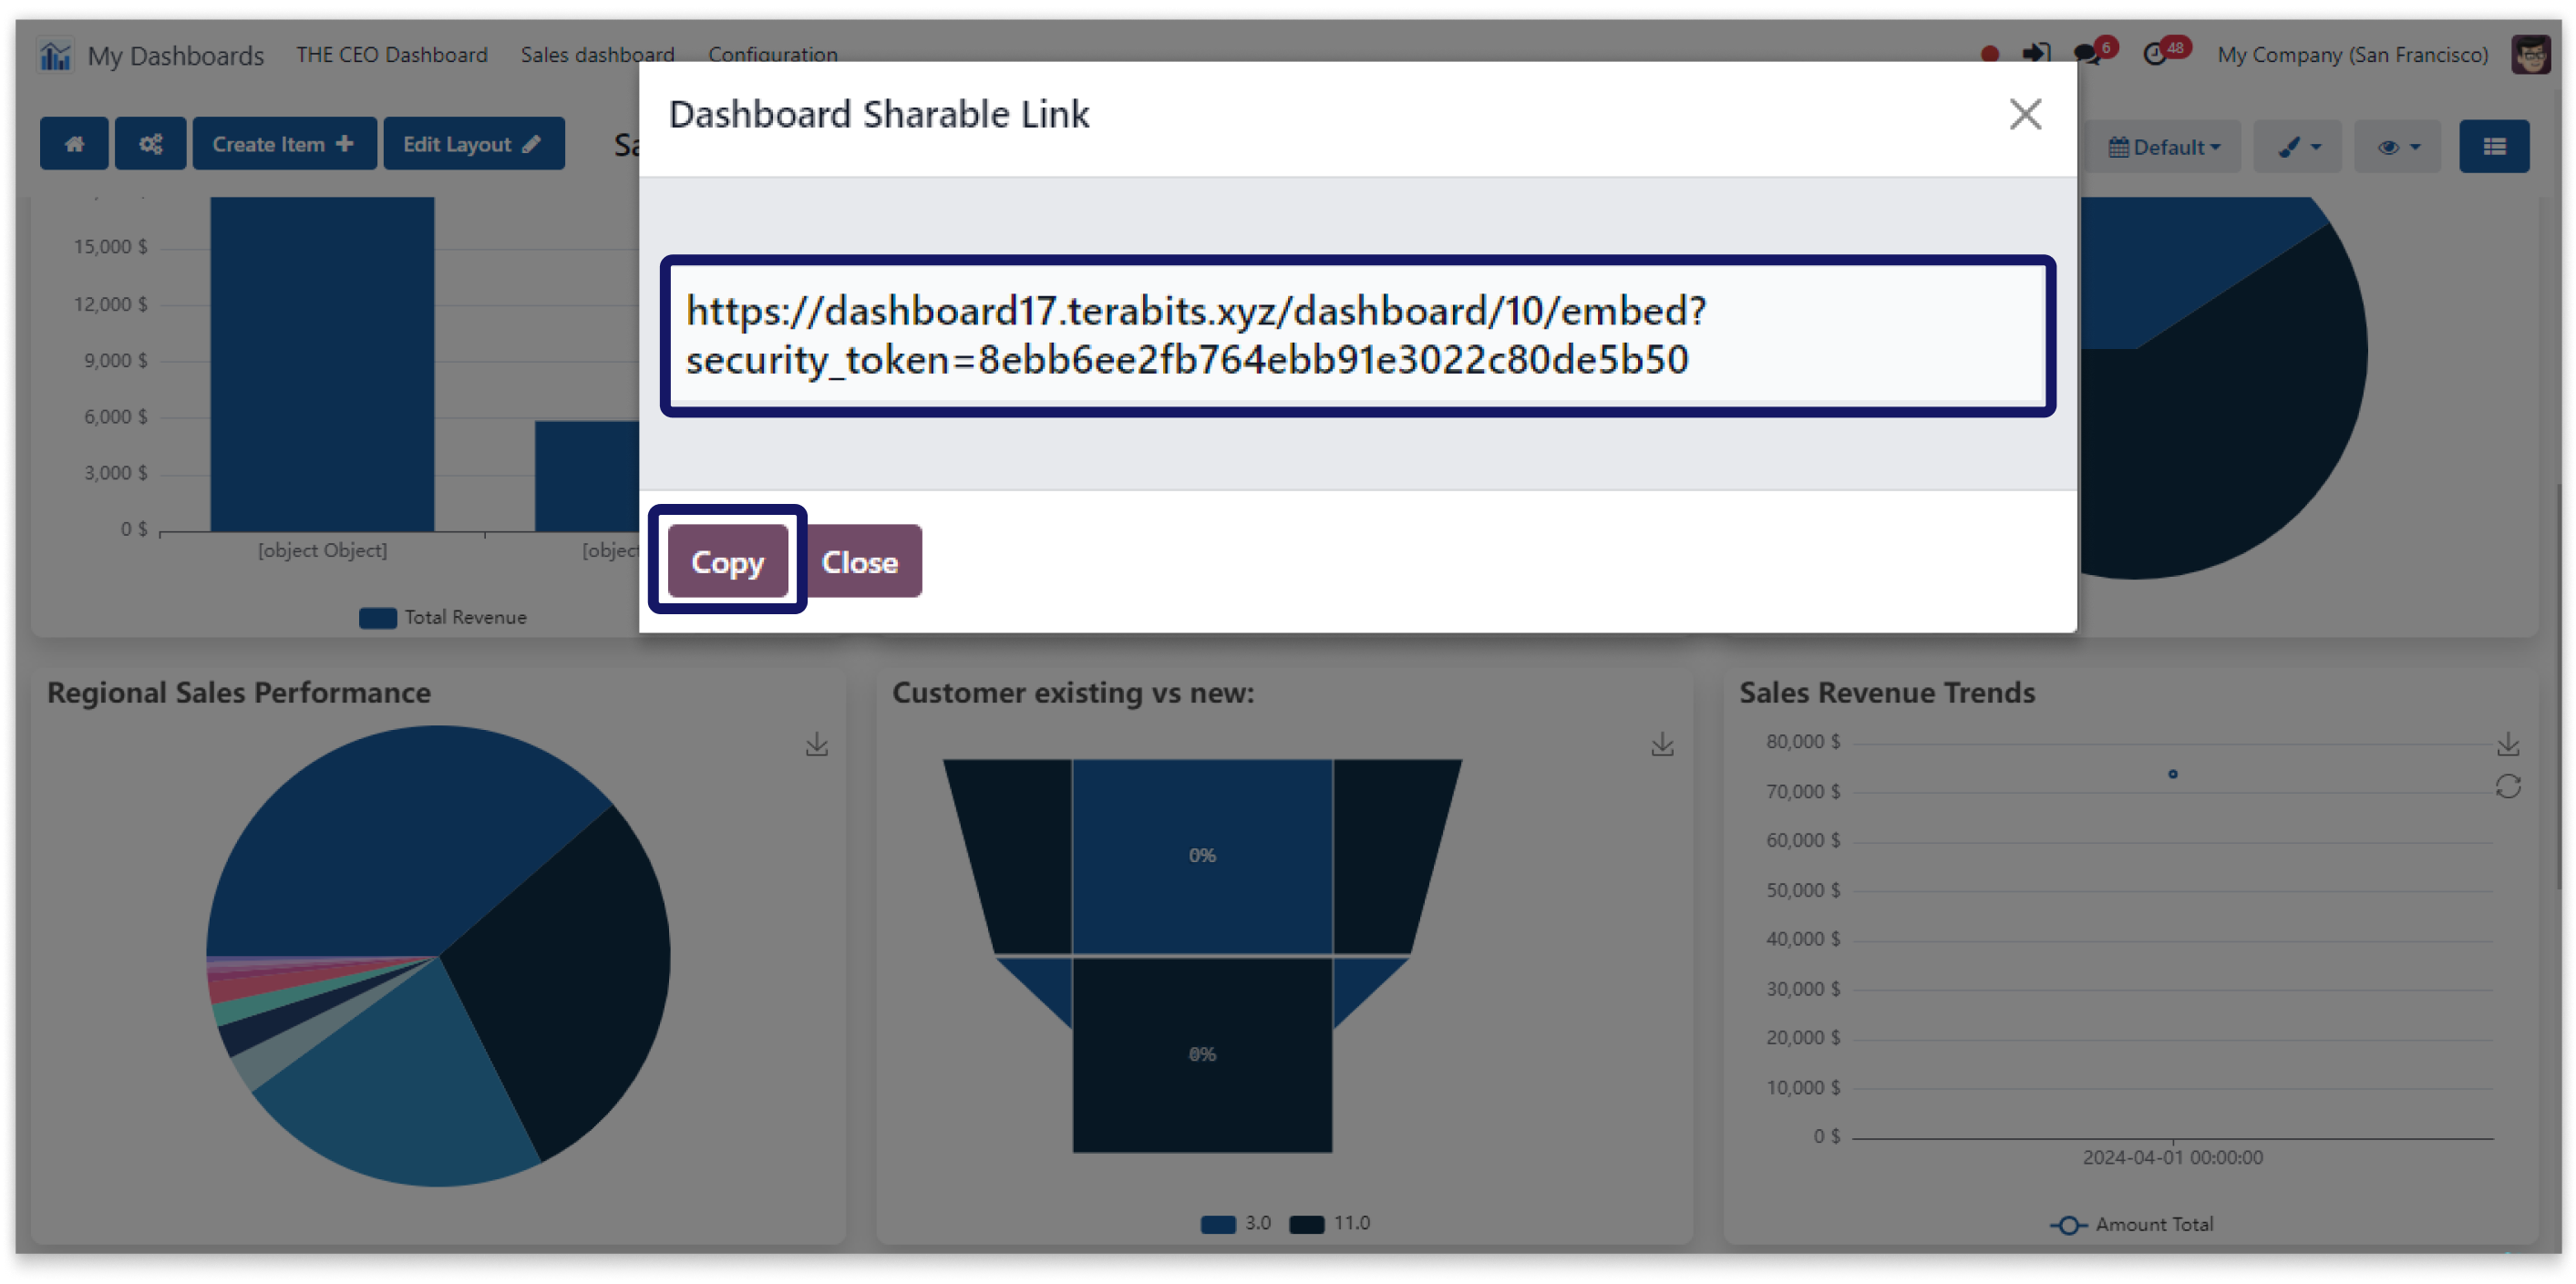
This will create an identical version of the dashboard, allowing you to make any
necessary adjustments or use it for different purposes without altering the original. -
Share dashboard links and create copies with ease.
-
Click on the image to zoom in.
Integrate and filter base module views directly in your dashboard interface.
You must have technical knowledge/technical person.
Not possible to create user-wise access rules.
Here is the solution
No need to have technical knowledge/technical person, Only you have to understand our module features.
Work in both Enterprise and Community versions(15,16,17).
Embed base module view
Here we have explained an example step by step.
This example shows how you can embed base view in your dashboard.
-
Embedding a base-view, such as form, tree, kanban, calendar, or pivot, into dashboard with the applied filter allows you to display specific data directly on your dashboard
-
This setup helps you to streamline your workflow by enabling quick access to the most relevant and essential information without navigating away from your dashboard.
-
Add base module views with applied filters to your dashboard for enhanced usability.
-
Double click on the video to zoom in.
Simplicity to import and export dashboards and dashboard items.
You must have technical knowledge/technical person.
Not possible to create user-wise access rules.
Here is the solution
No need to have technical knowledge/technical person, Only you have to understand our module features.
Work in both Enterprise and Community versions(15,16,17).
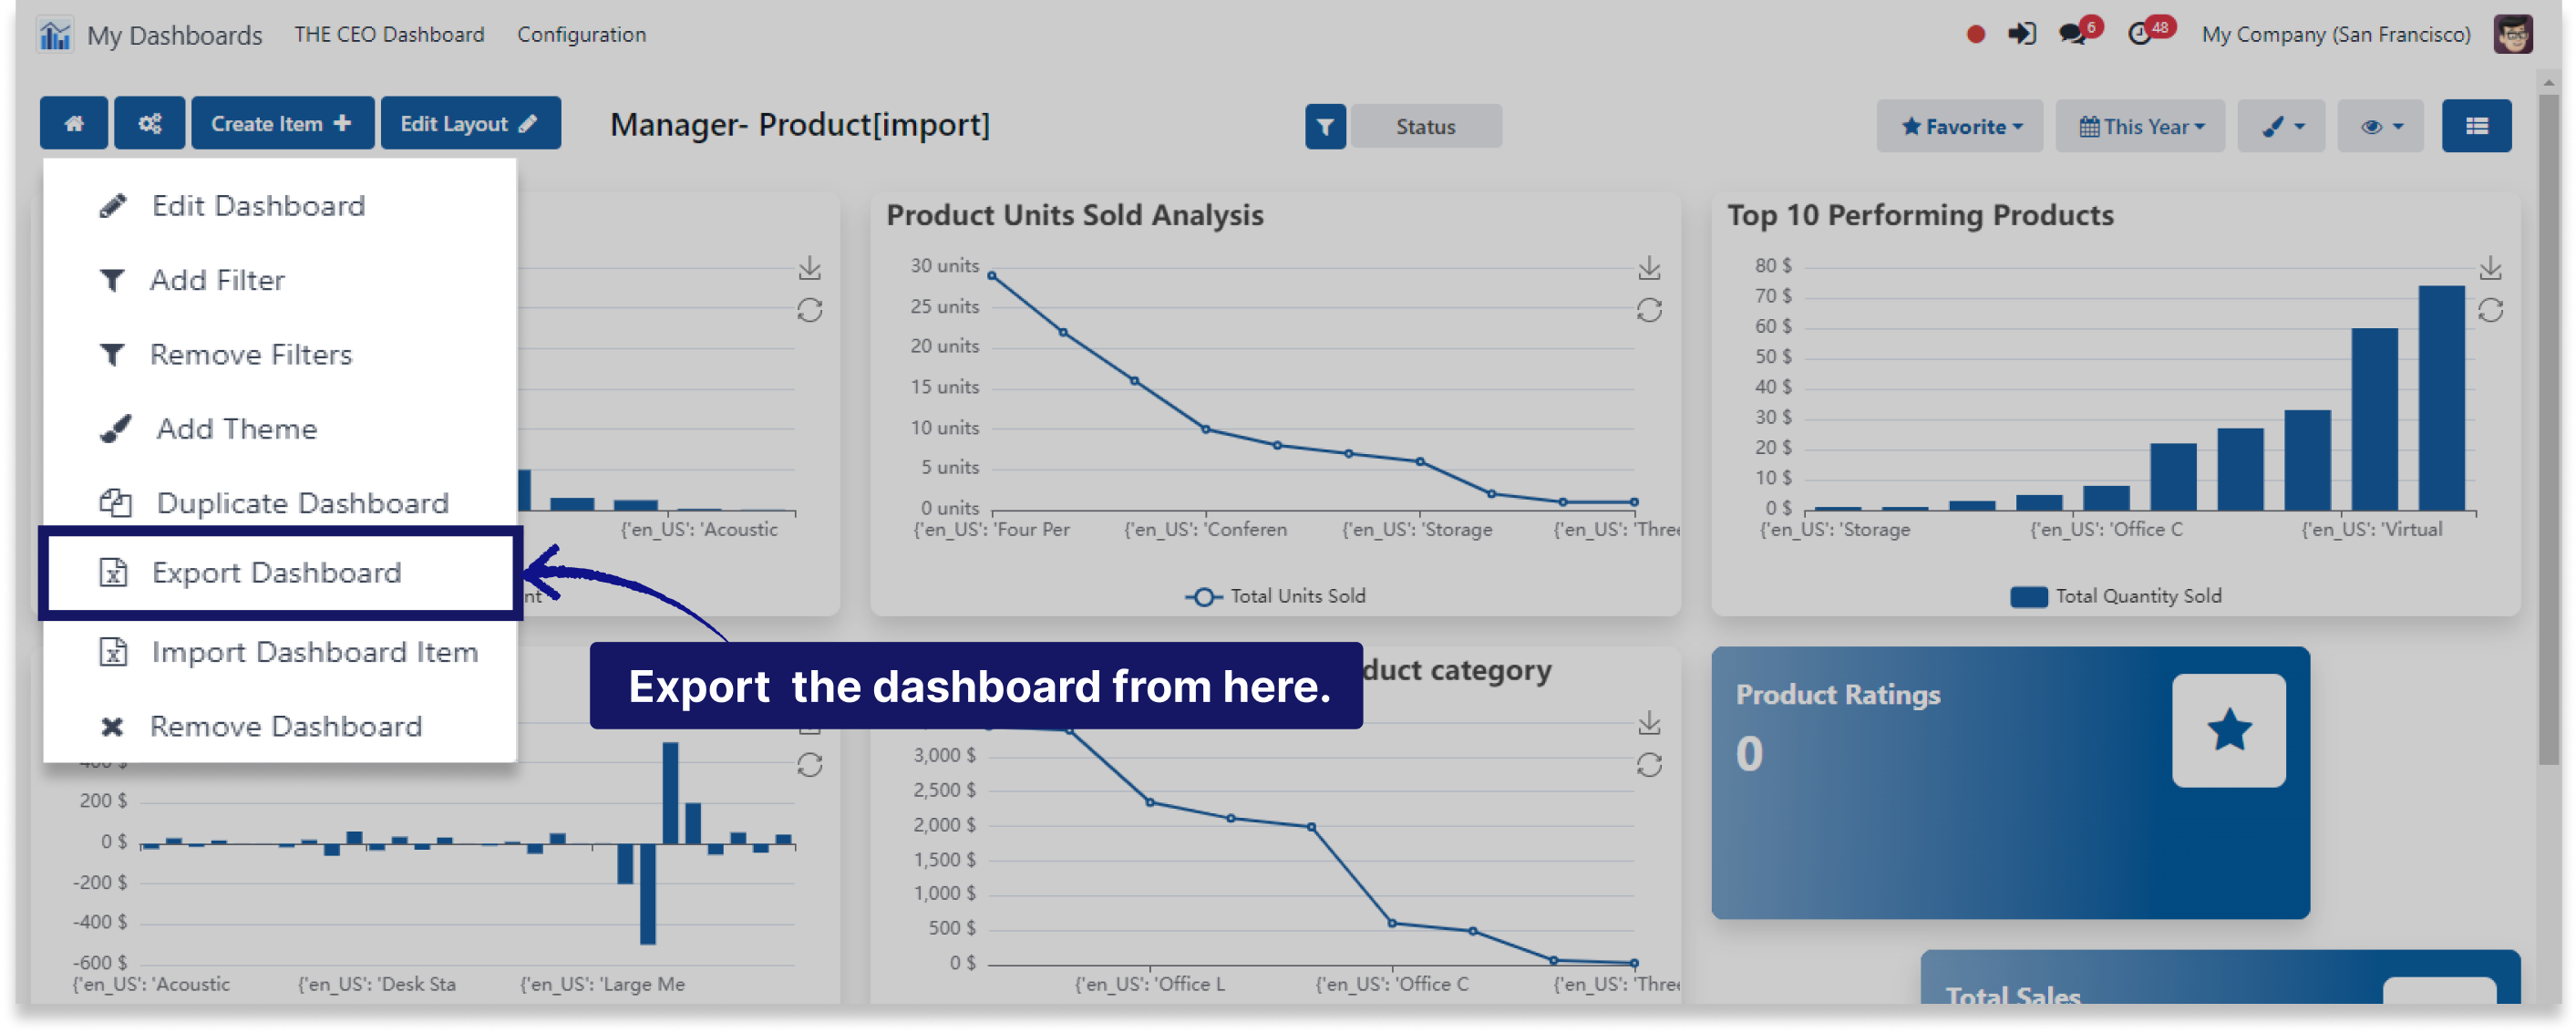
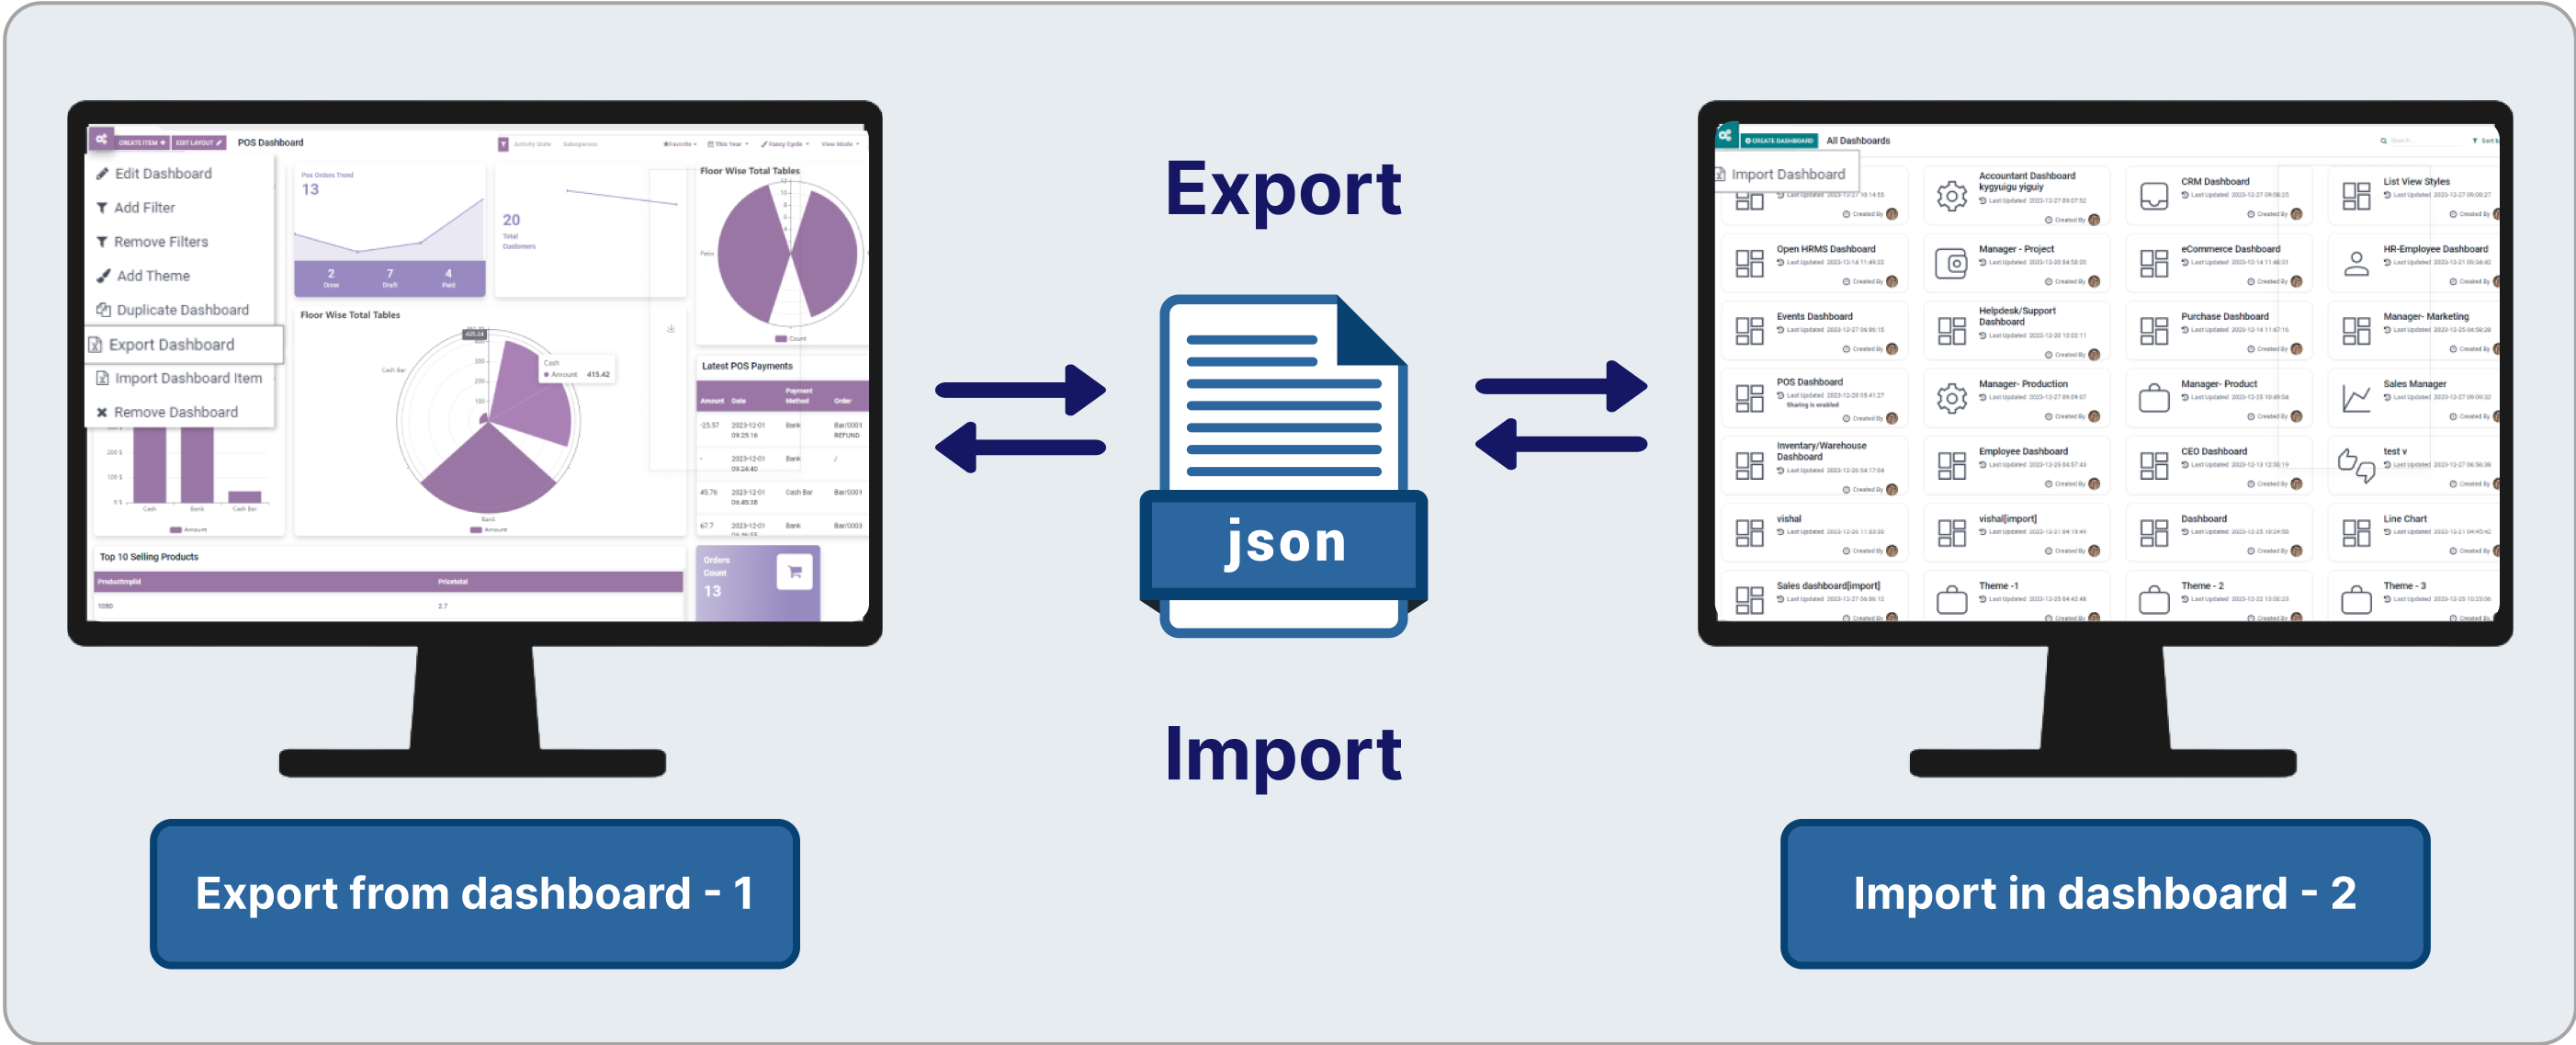
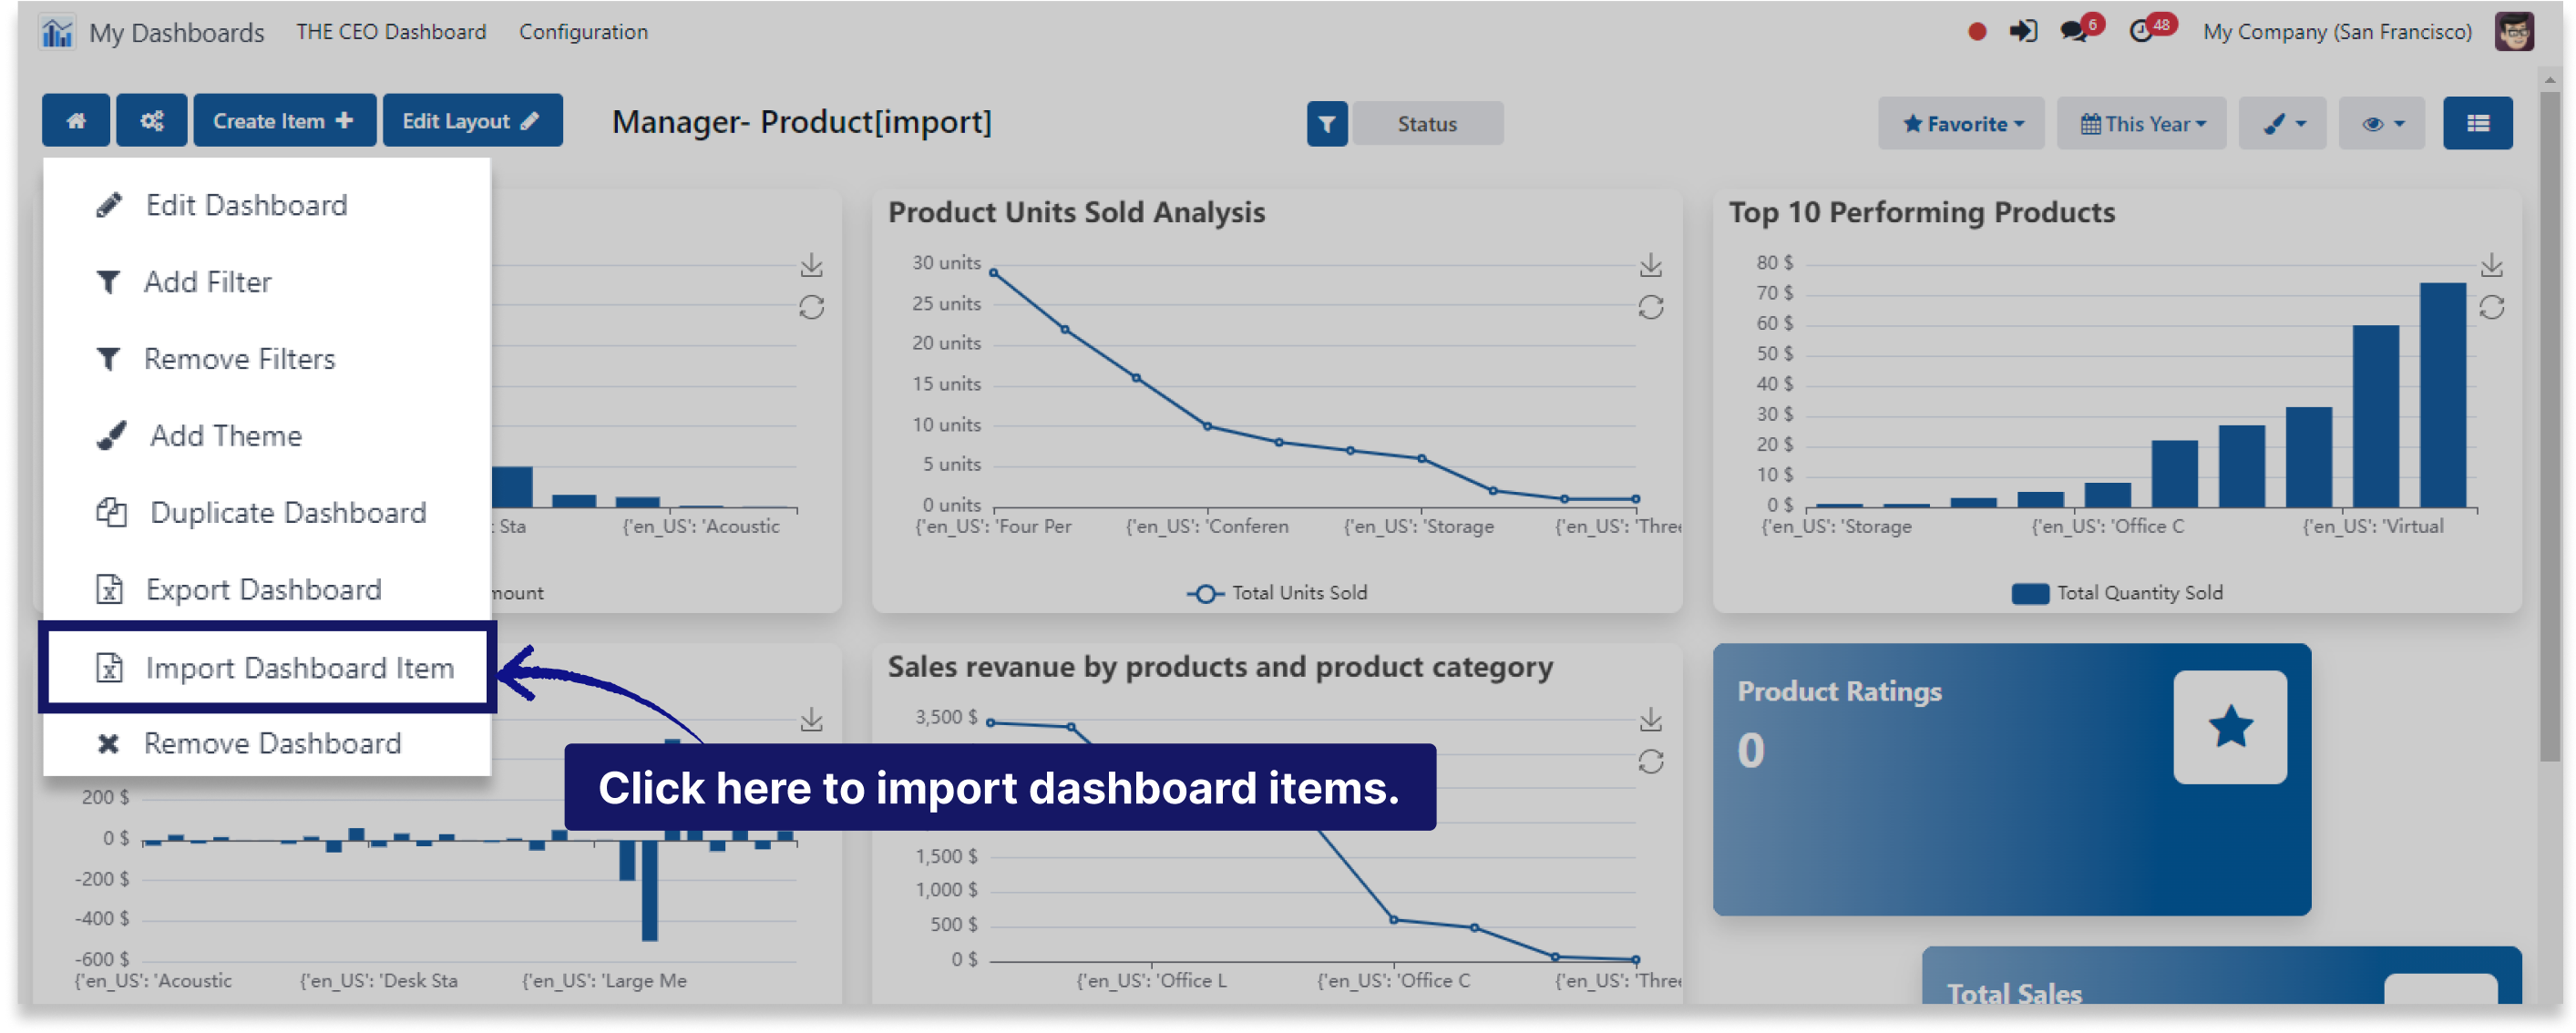
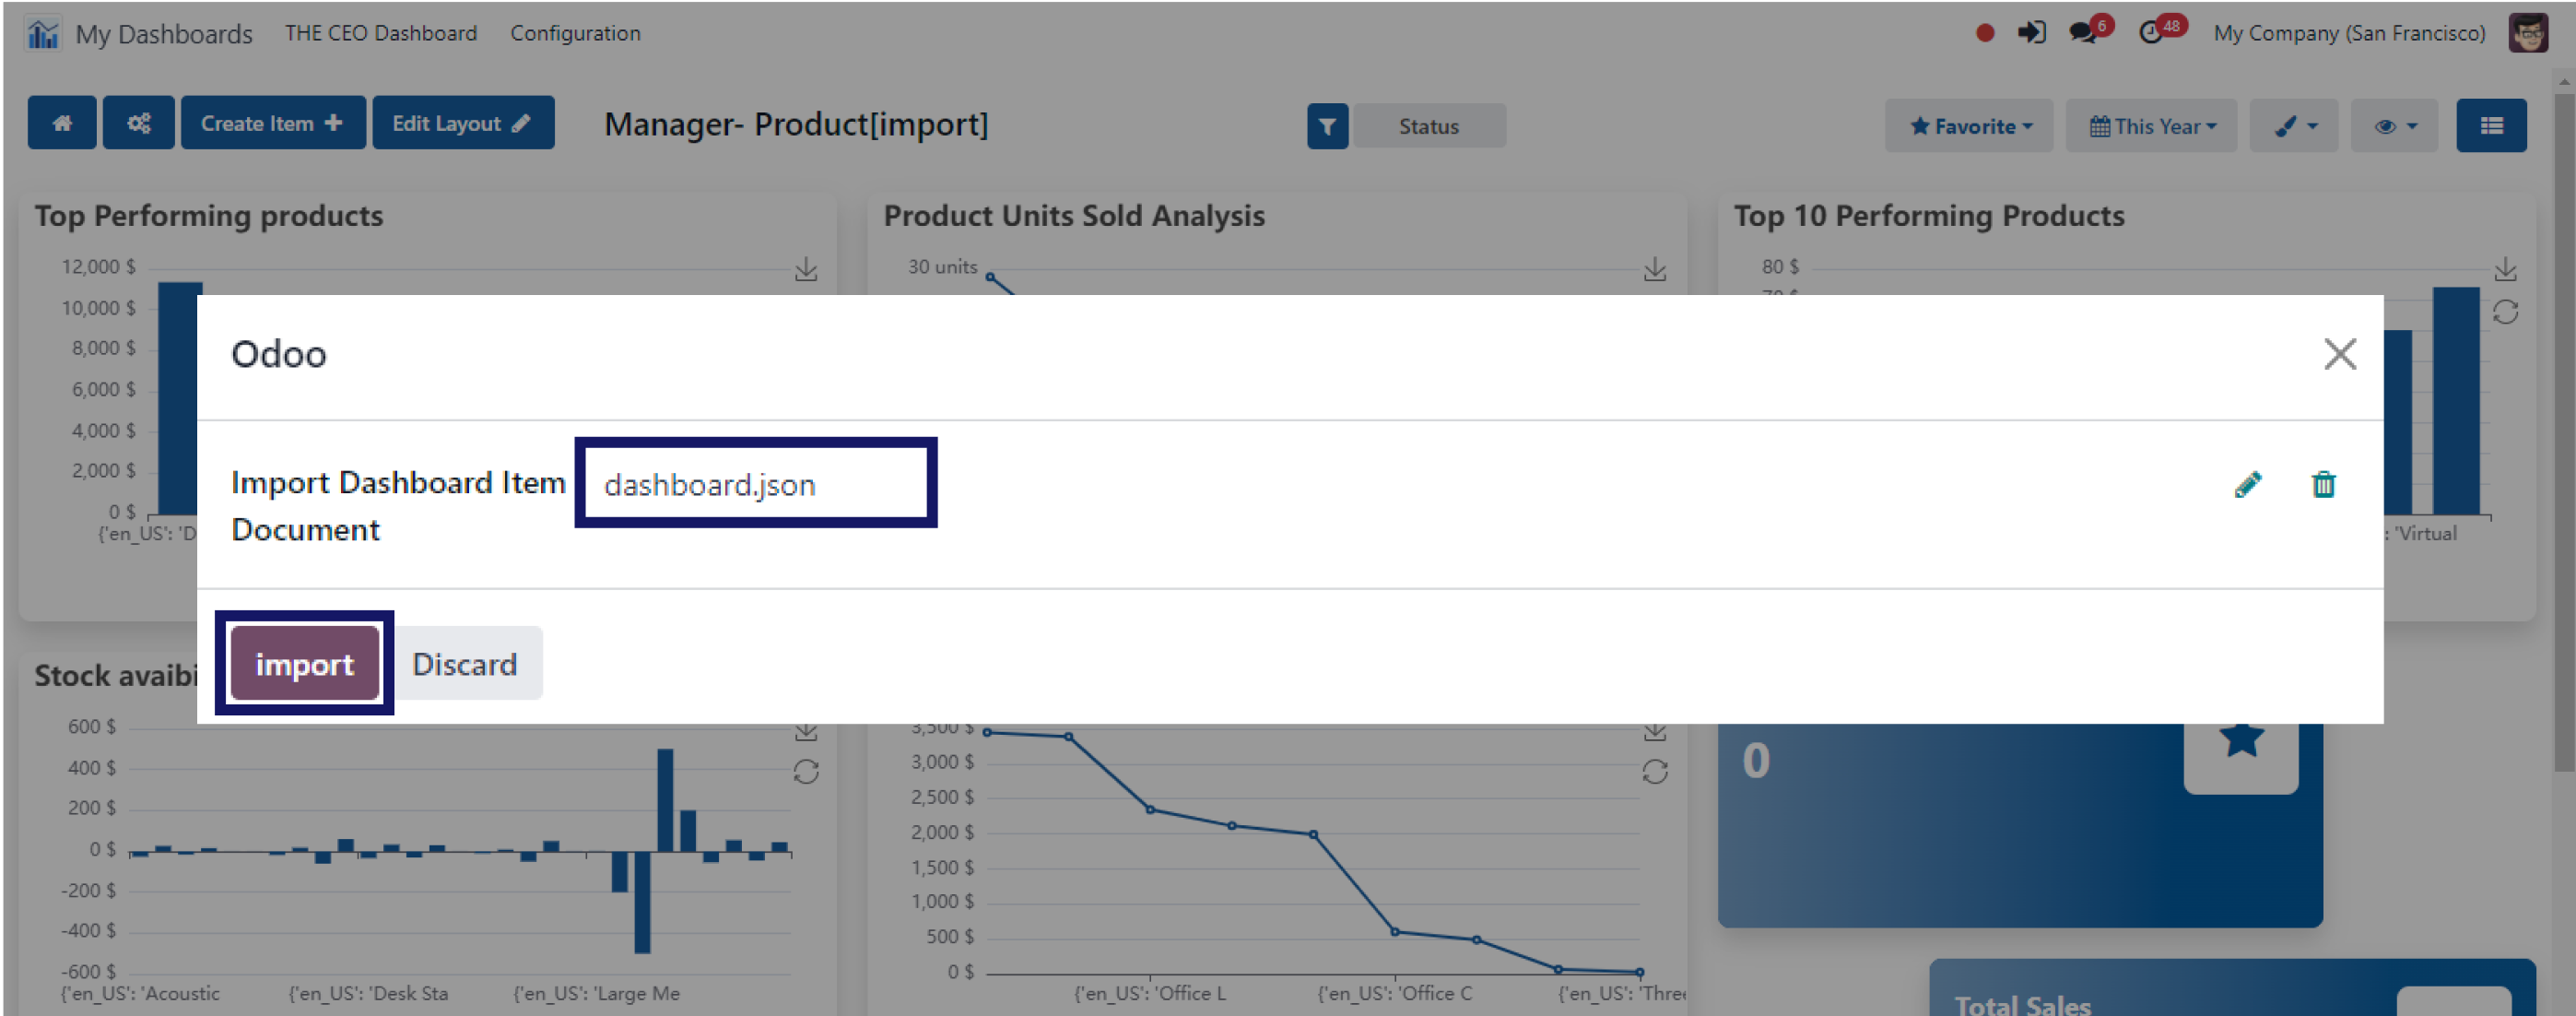
Import/Export dashboard
Here we have explained an example step by step.
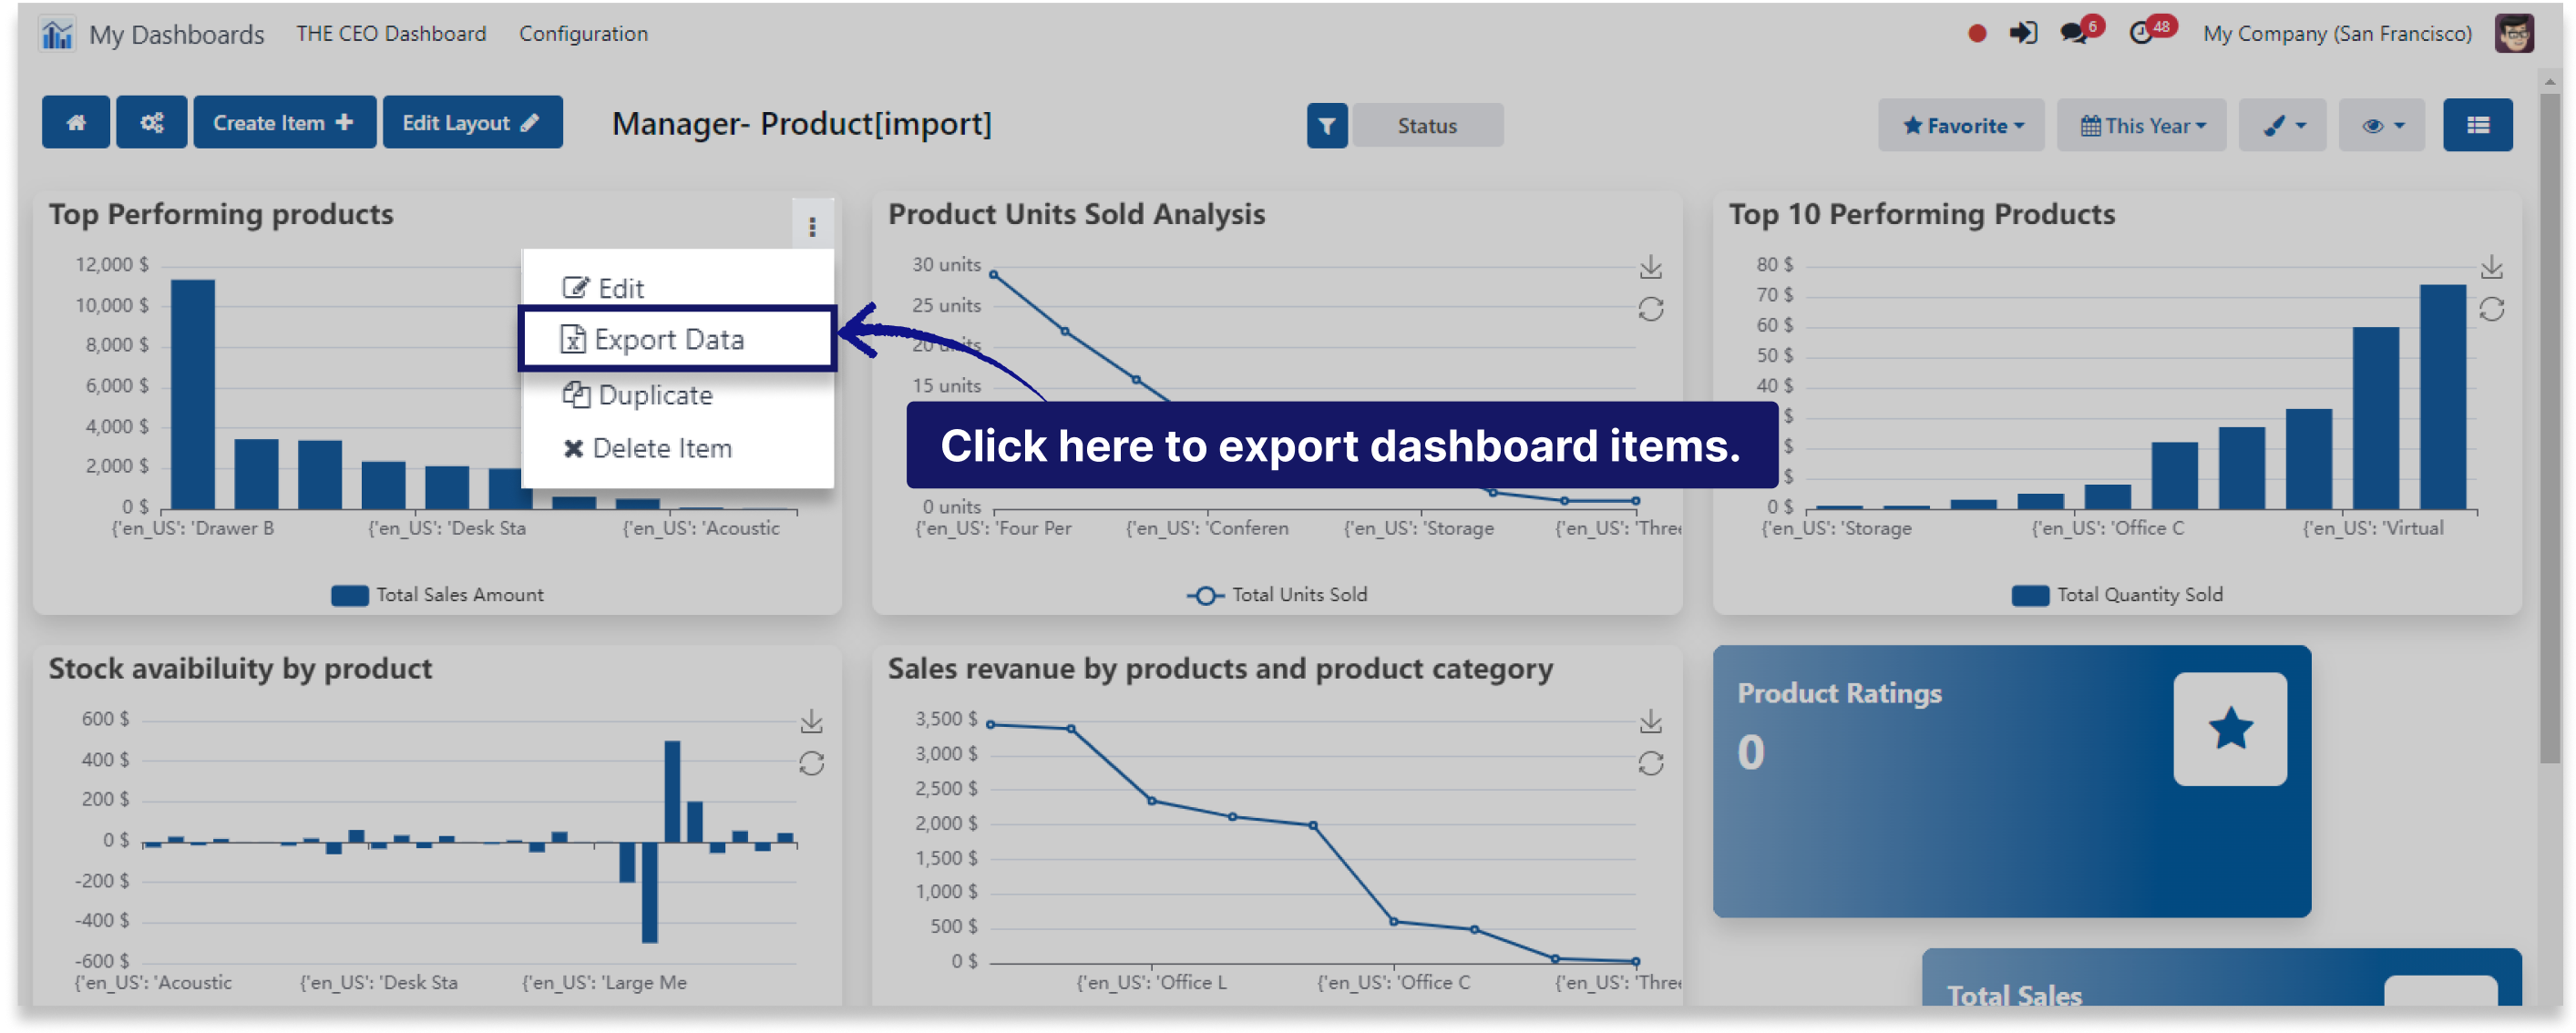
This example shows how you can import/export the dashboard and dashboard items.
-
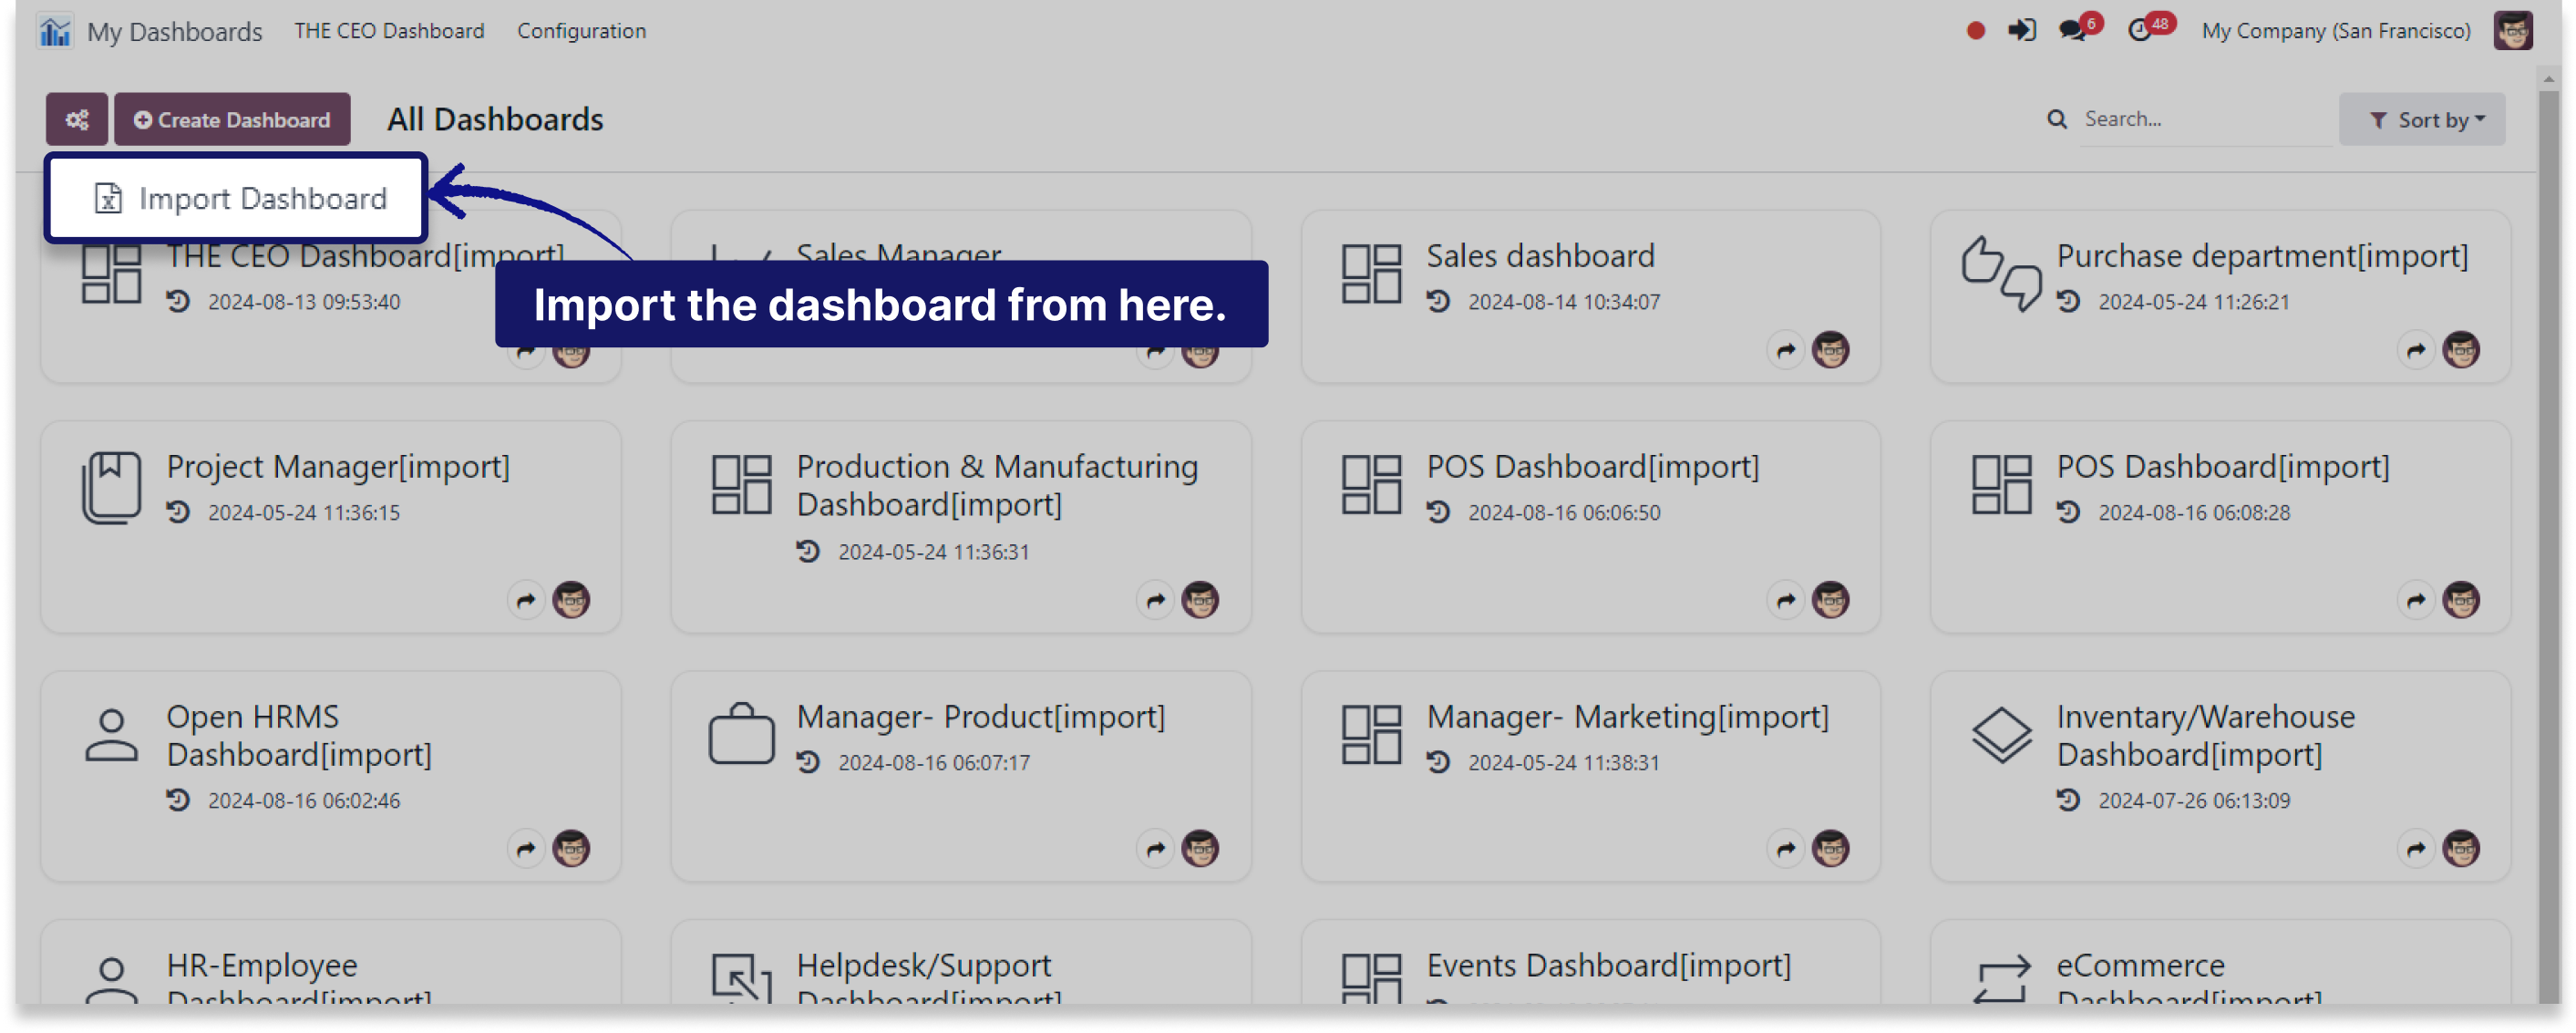
Importing your dashboards is designed to be as seamless as creating them, ensuring that your dashboards remain portable and easily adaptable to the changing demands of your business.
-
You can effortlessly transport your customized dashboards by exporting them in JSON format, which simplifies the process of making backups or sharing your configurations with others.
-
Click on the image to zoom in.
-
This feature allows you to preserve the exact layout, filters, and data views of your dashboards, making it easy to replicate or transfer your settings to different environments, ensuring consistency and flexibility as your business evolves.
-
Import and export the dashboard items in json format.
-
Click on the image to zoom in.
Get 10+ ready-to-use modern theme color palettes.
You must have technical knowledge/technical person.
Not possible to create user-wise access rules.
Here is the solution
No need to have technical knowledge/technical person, Only you have to understand our module features.
Work in both Enterprise and Community versions(15,16,17).
10+ Predefined dashboard themes
Here we have explained an example step by step.
This example shows how you can create custom color palette as per your brand logo.
-
The option to create a custom color palette from your brand logo provides a powerful way to maintain brand consistency across your projects.
-
By extracting colors directly from your logo, you can generate a tailored palette that reflects your brand's unique identity.
-
This feature allows you to pull key colors, such as primary and accent shades, directly from your logo image, ensuring that your designs, presentations, and marketing materials are visually aligned with your brand.
-
Click on the gif to zoom in.

-
Get free predefined odoo dashboards
-
Get paid predefined main odoo modules(sales, POS, HR, employee, helpdesk, website, etc) dashboard templates.
-
Click on the gif to zoom in.

Load your dashboard data with the types of predefined filters.
You must have technical knowledge/technical person.
Not possible to create user-wise access rules.
Here is the solution
No need to have technical knowledge/technical person, Only you have to understand our module features.
Work in both Enterprise and Community versions(15,16,17).
Advance date filters
Here we have explained an example step by step.
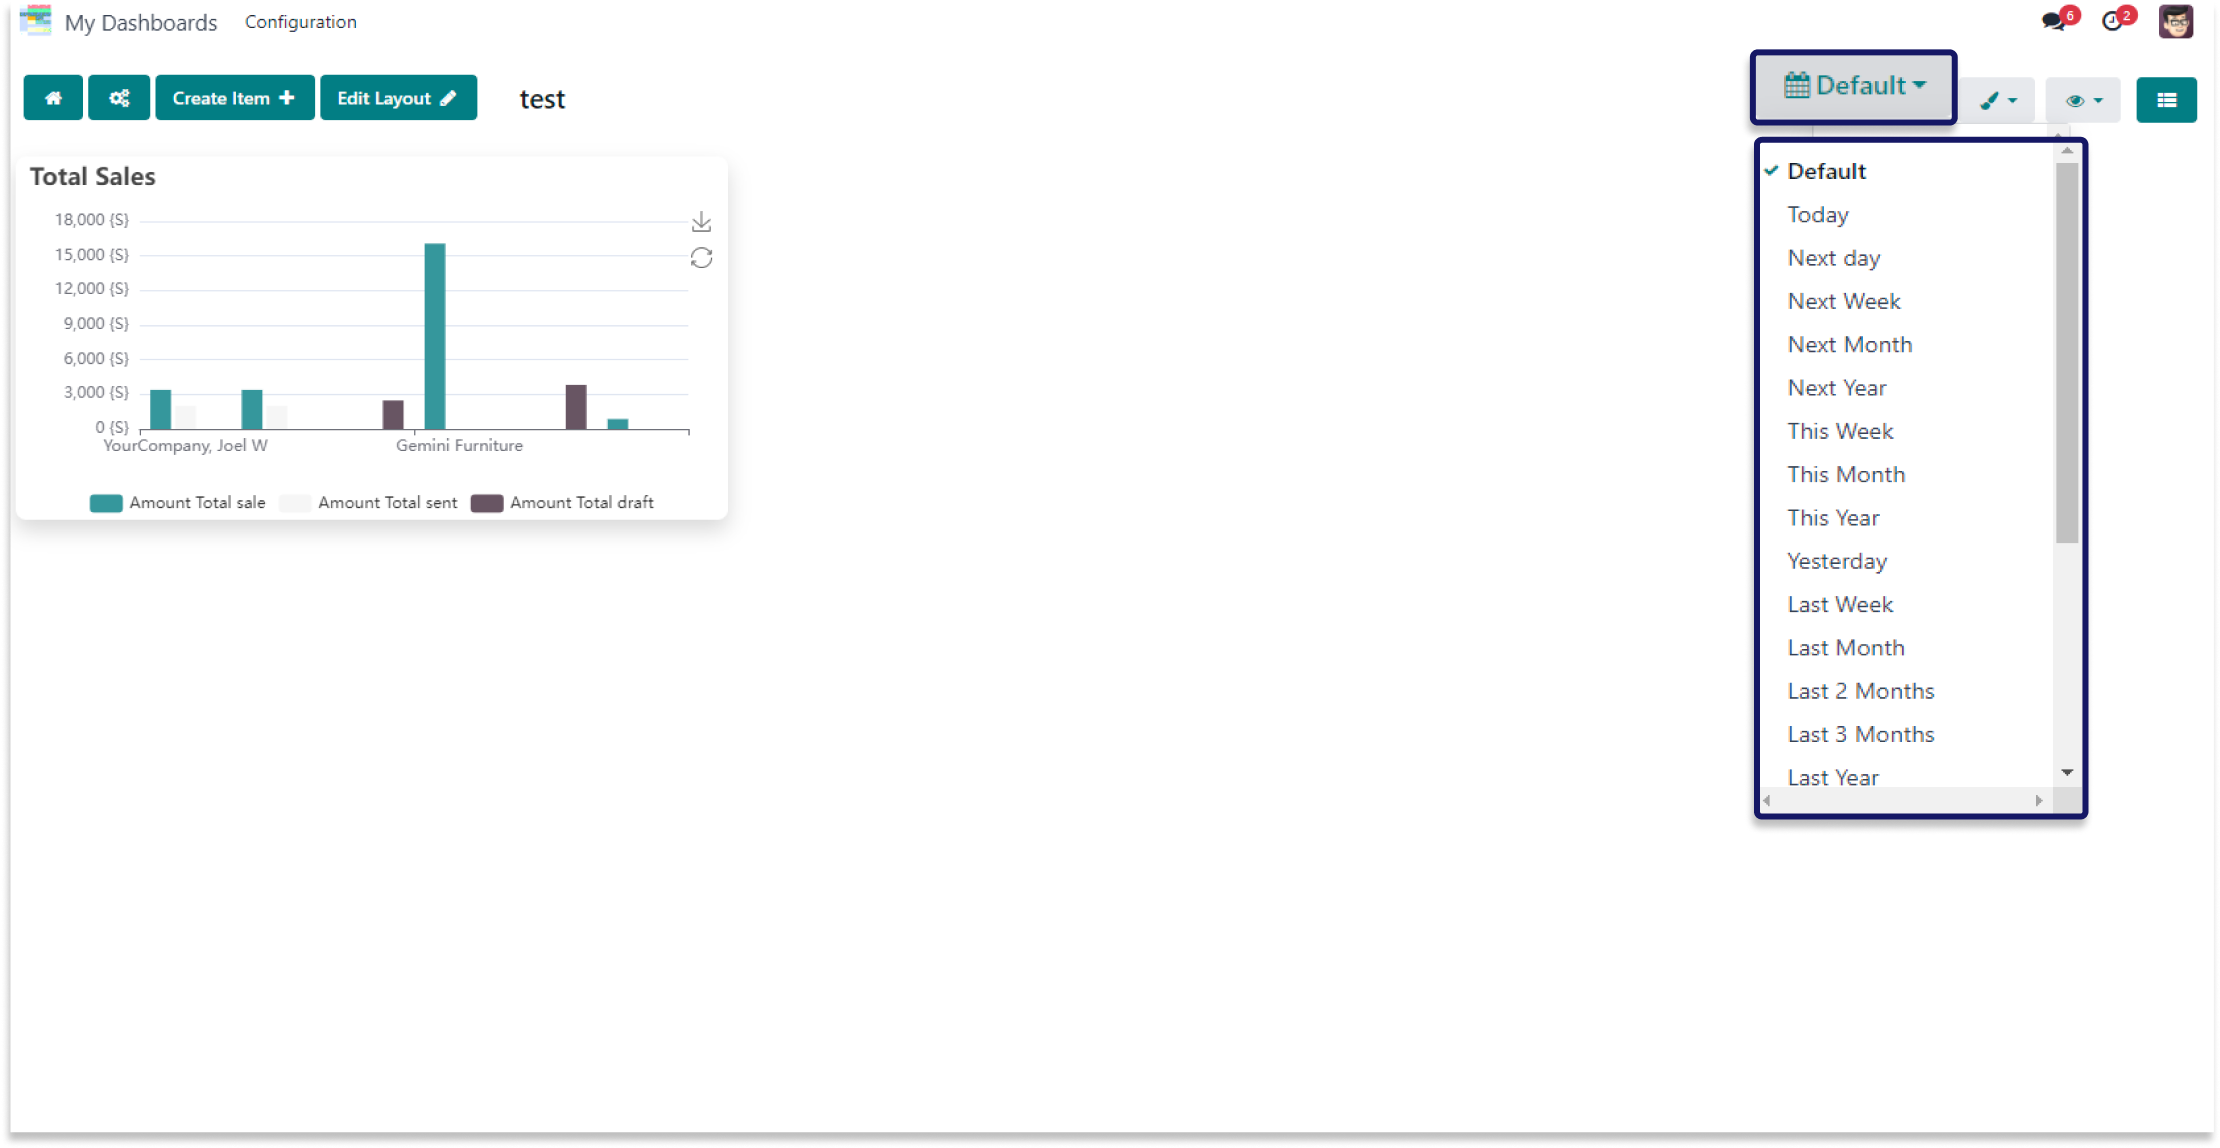
This example shows how you can create advance dashboard date with predefined filters
-
Loading your dashboard data with predefined filter allows you to instantly access the most relevant information without the need to manually apply filters each time.
-
By utilizing predefined filters, you enhance efficiency and ensure consistency in the way data is viewed across different sessions.
-
There are many types of predefined filters like (Default, Today, Next Day, Next Week, Next Month, Next Year, This Week, This Month, This Year, Yesterday, Last Week, Last Month, Last 2 Month, Last 3 Month, Last Year, Last 24 hours, Last 3 Month, Last Year, Last 24 hours, Last 10 Days, Last 30 Days, Last 60 Days, Last 90 Days, Last 365 Days, and Custom Range).
-
Click on the image to zoom in.
Access the data through SQL query.
You must have technical knowledge/technical person.
Not possible to create user-wise access rules.
Here is the solution
No need to have technical knowledge/technical person, Only you have to understand our module features.
Work in both Enterprise and Community versions(15,16,17).
Retrive data by SQL query.
Here we have explained an example step by step.
This example shows how you can simplify access the data by sql query.
-
Seamlessly access and analyze specific data sets by crafting custom queries tailored to your business needs.
-
Whether you're seeking detailed insights, filtering information, or conducting targeted analysis, this feature puts the power of data retrieval in your hands.
-
It empowers you to make data-driven decisions efficiently and effectively.
-
Click on the gif to zoom in.

Create custom filters from dashboard.
You must have technical knowledge/technical person.
Not possible to create user-wise access rules.
Here is the solution
No need to have technical knowledge/technical person, Only you have to understand our module features.
Work in both Enterprise and Community versions(15,16,17).
Option to create a custom filter
Here we have explained an example step by step.
This example shows how you can create custom filter directly from the dashboard.
-
You can easily create custom filters directly from the dashboard to tailor the data displayed to your specific needs.
-
Once a filter is added, it automatically applies and displays the filtered data without requiring any additional steps.
-
This ensures that your dashboard consistently shows the most relevant information based on your custom criteria.
-
Double click on the video to zoom in.
Customize dashboard access for users.
You must have technical knowledge/technical person.
Not possible to create user-wise access rules.
Here is the solution
No need to have technical knowledge/technical person, Only you have to understand our module features.
Work in both Enterprise and Community versions(15,16,17).
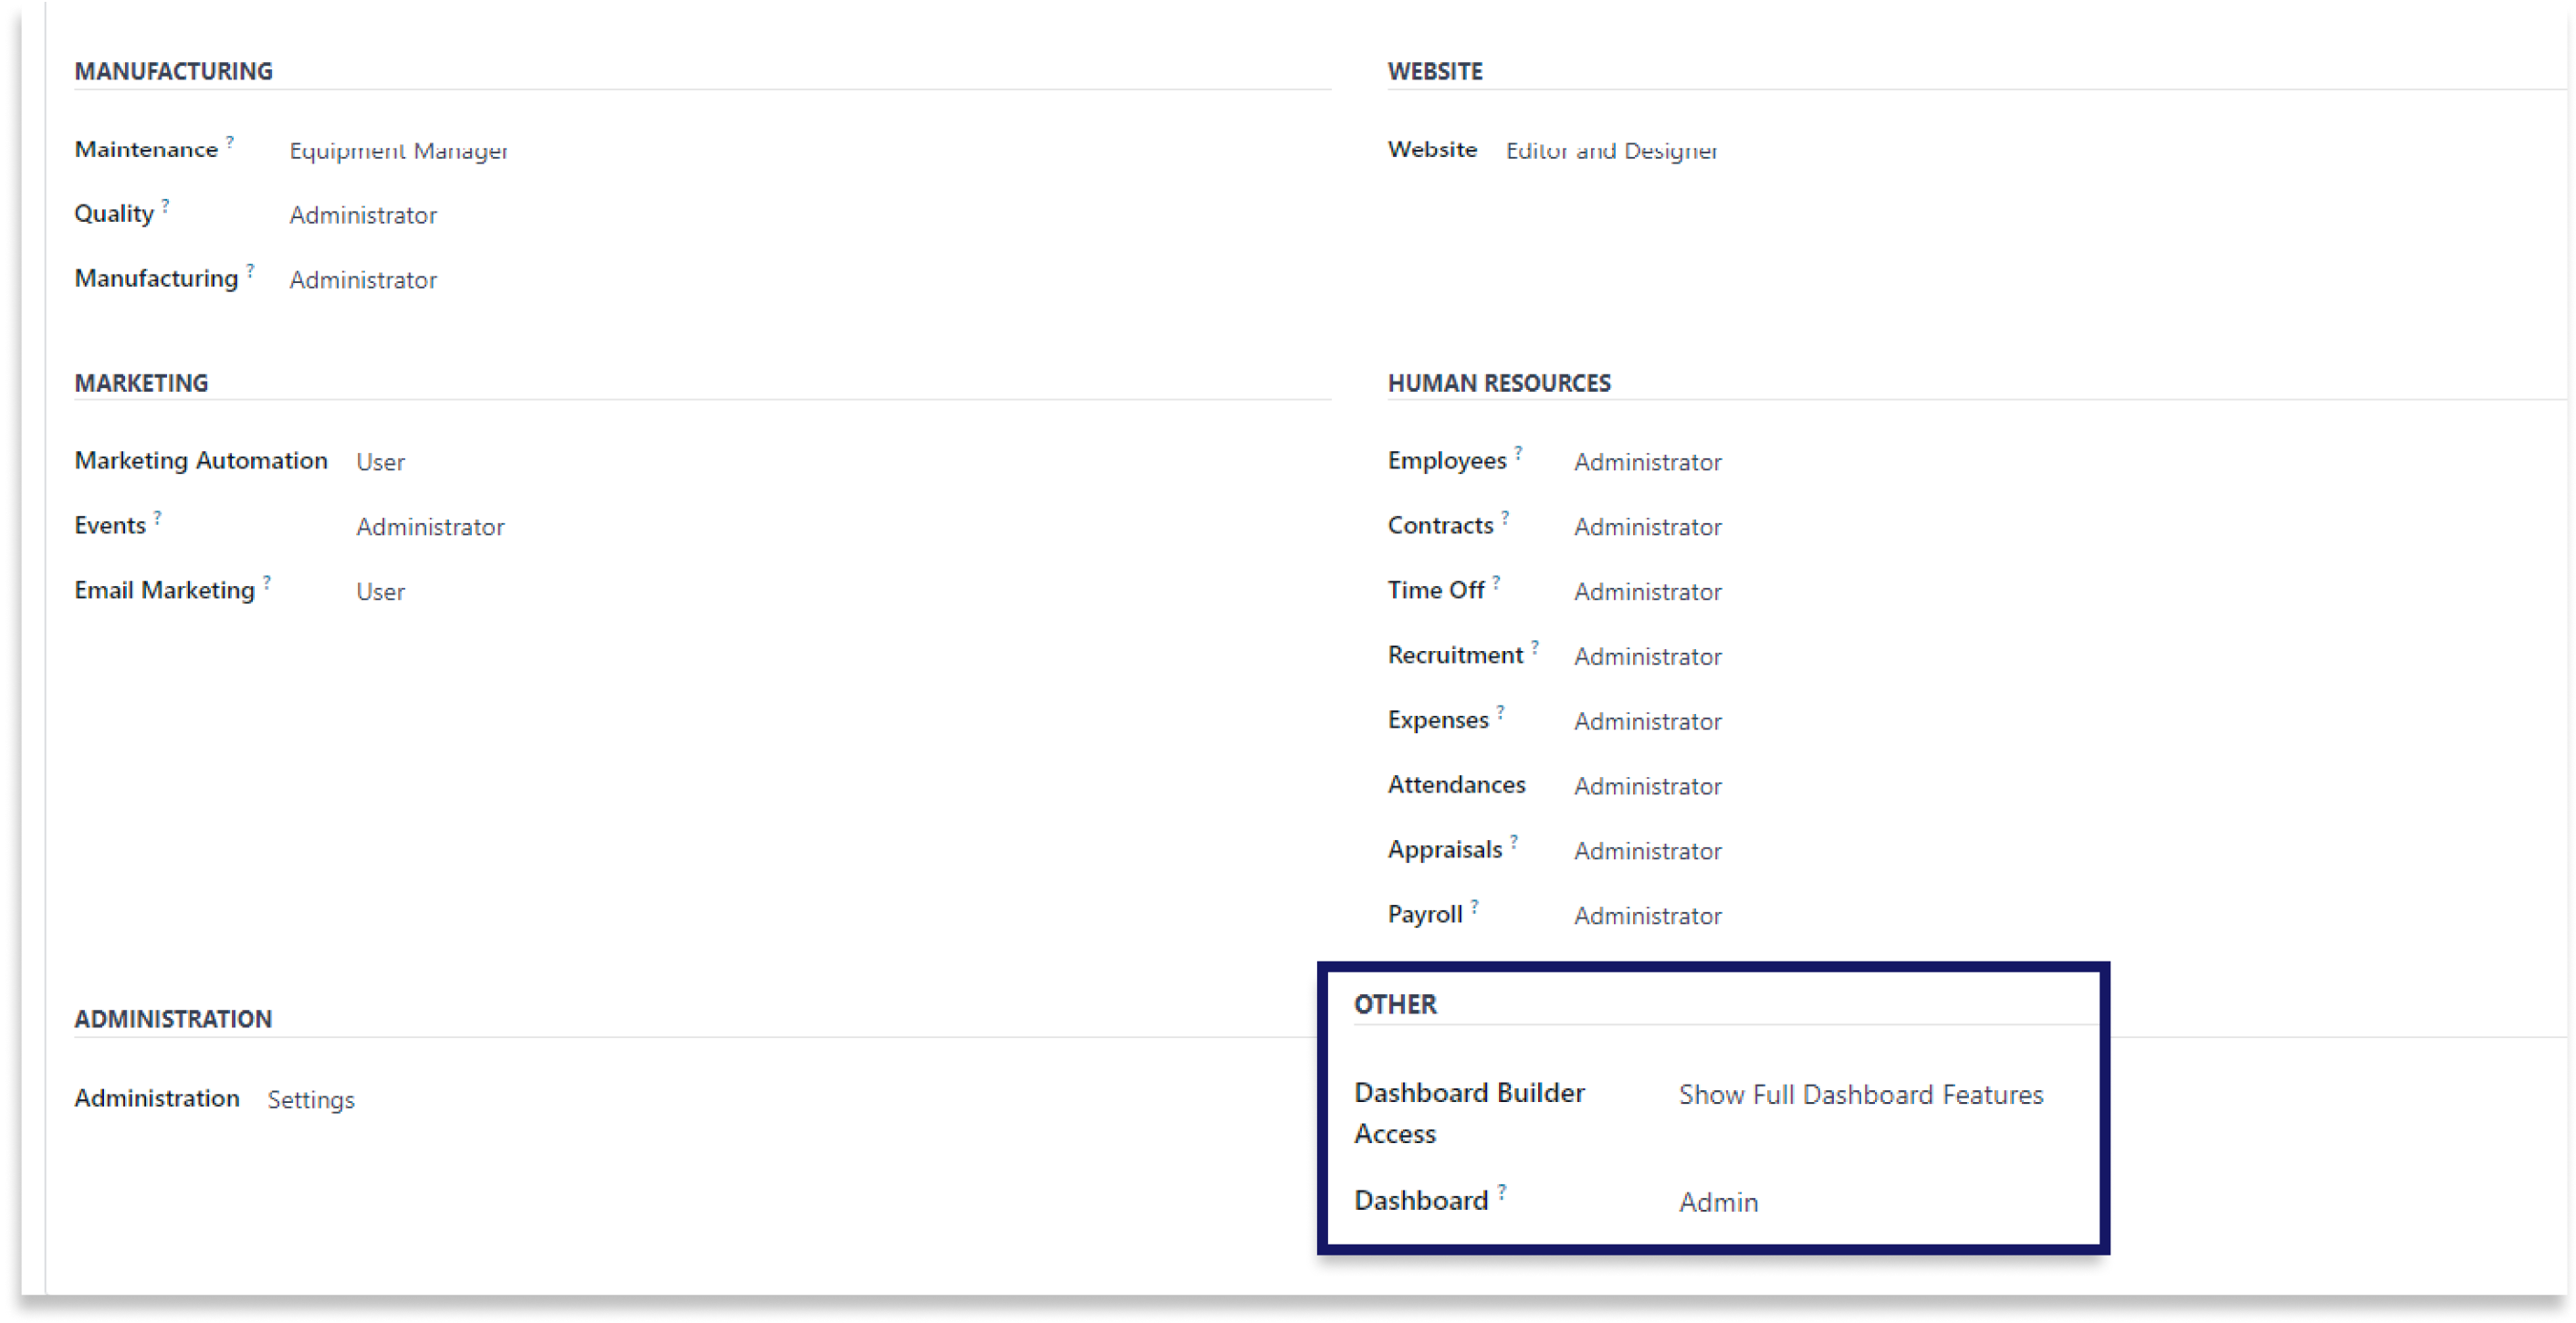
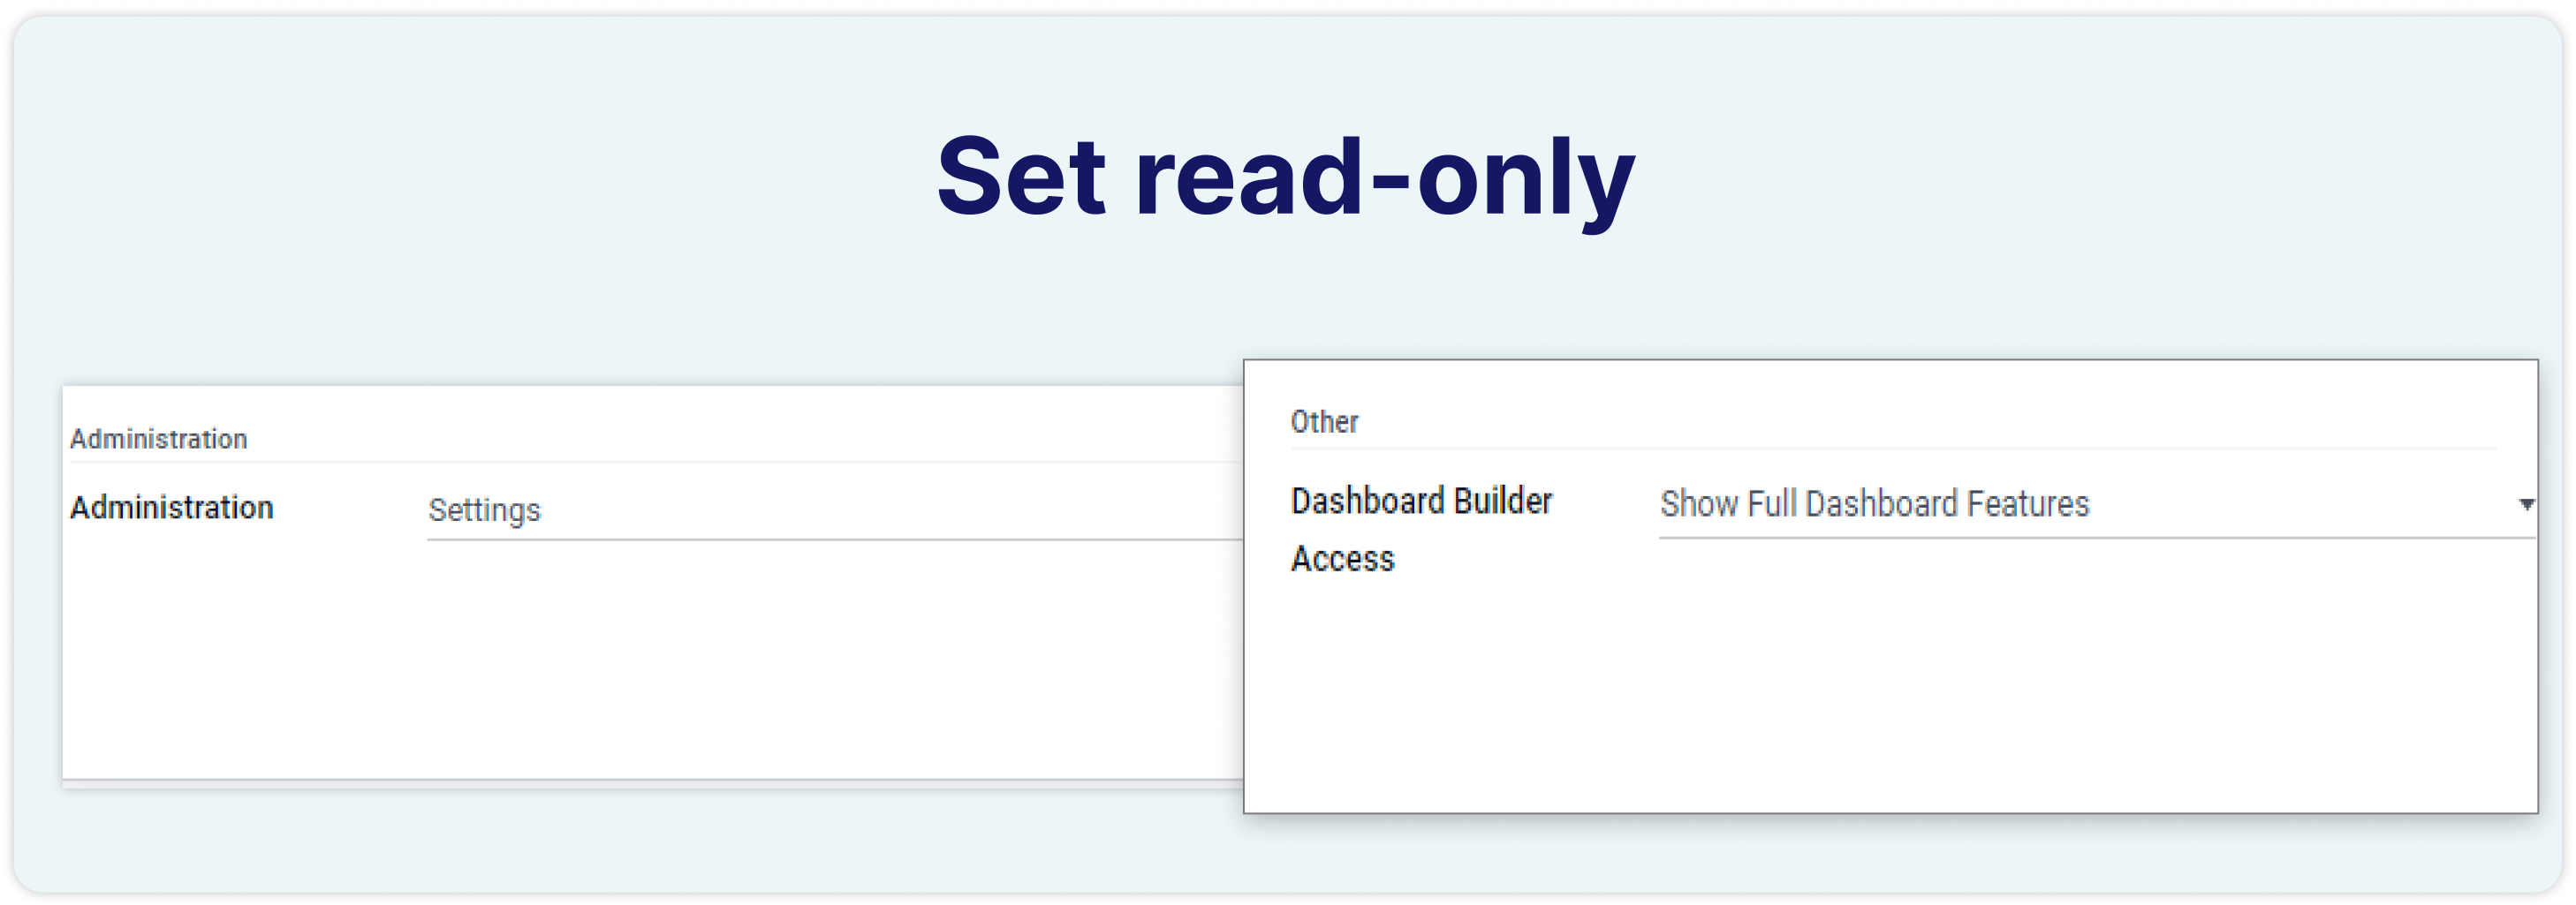
Streamline access control
Here we have explained an example step by step.
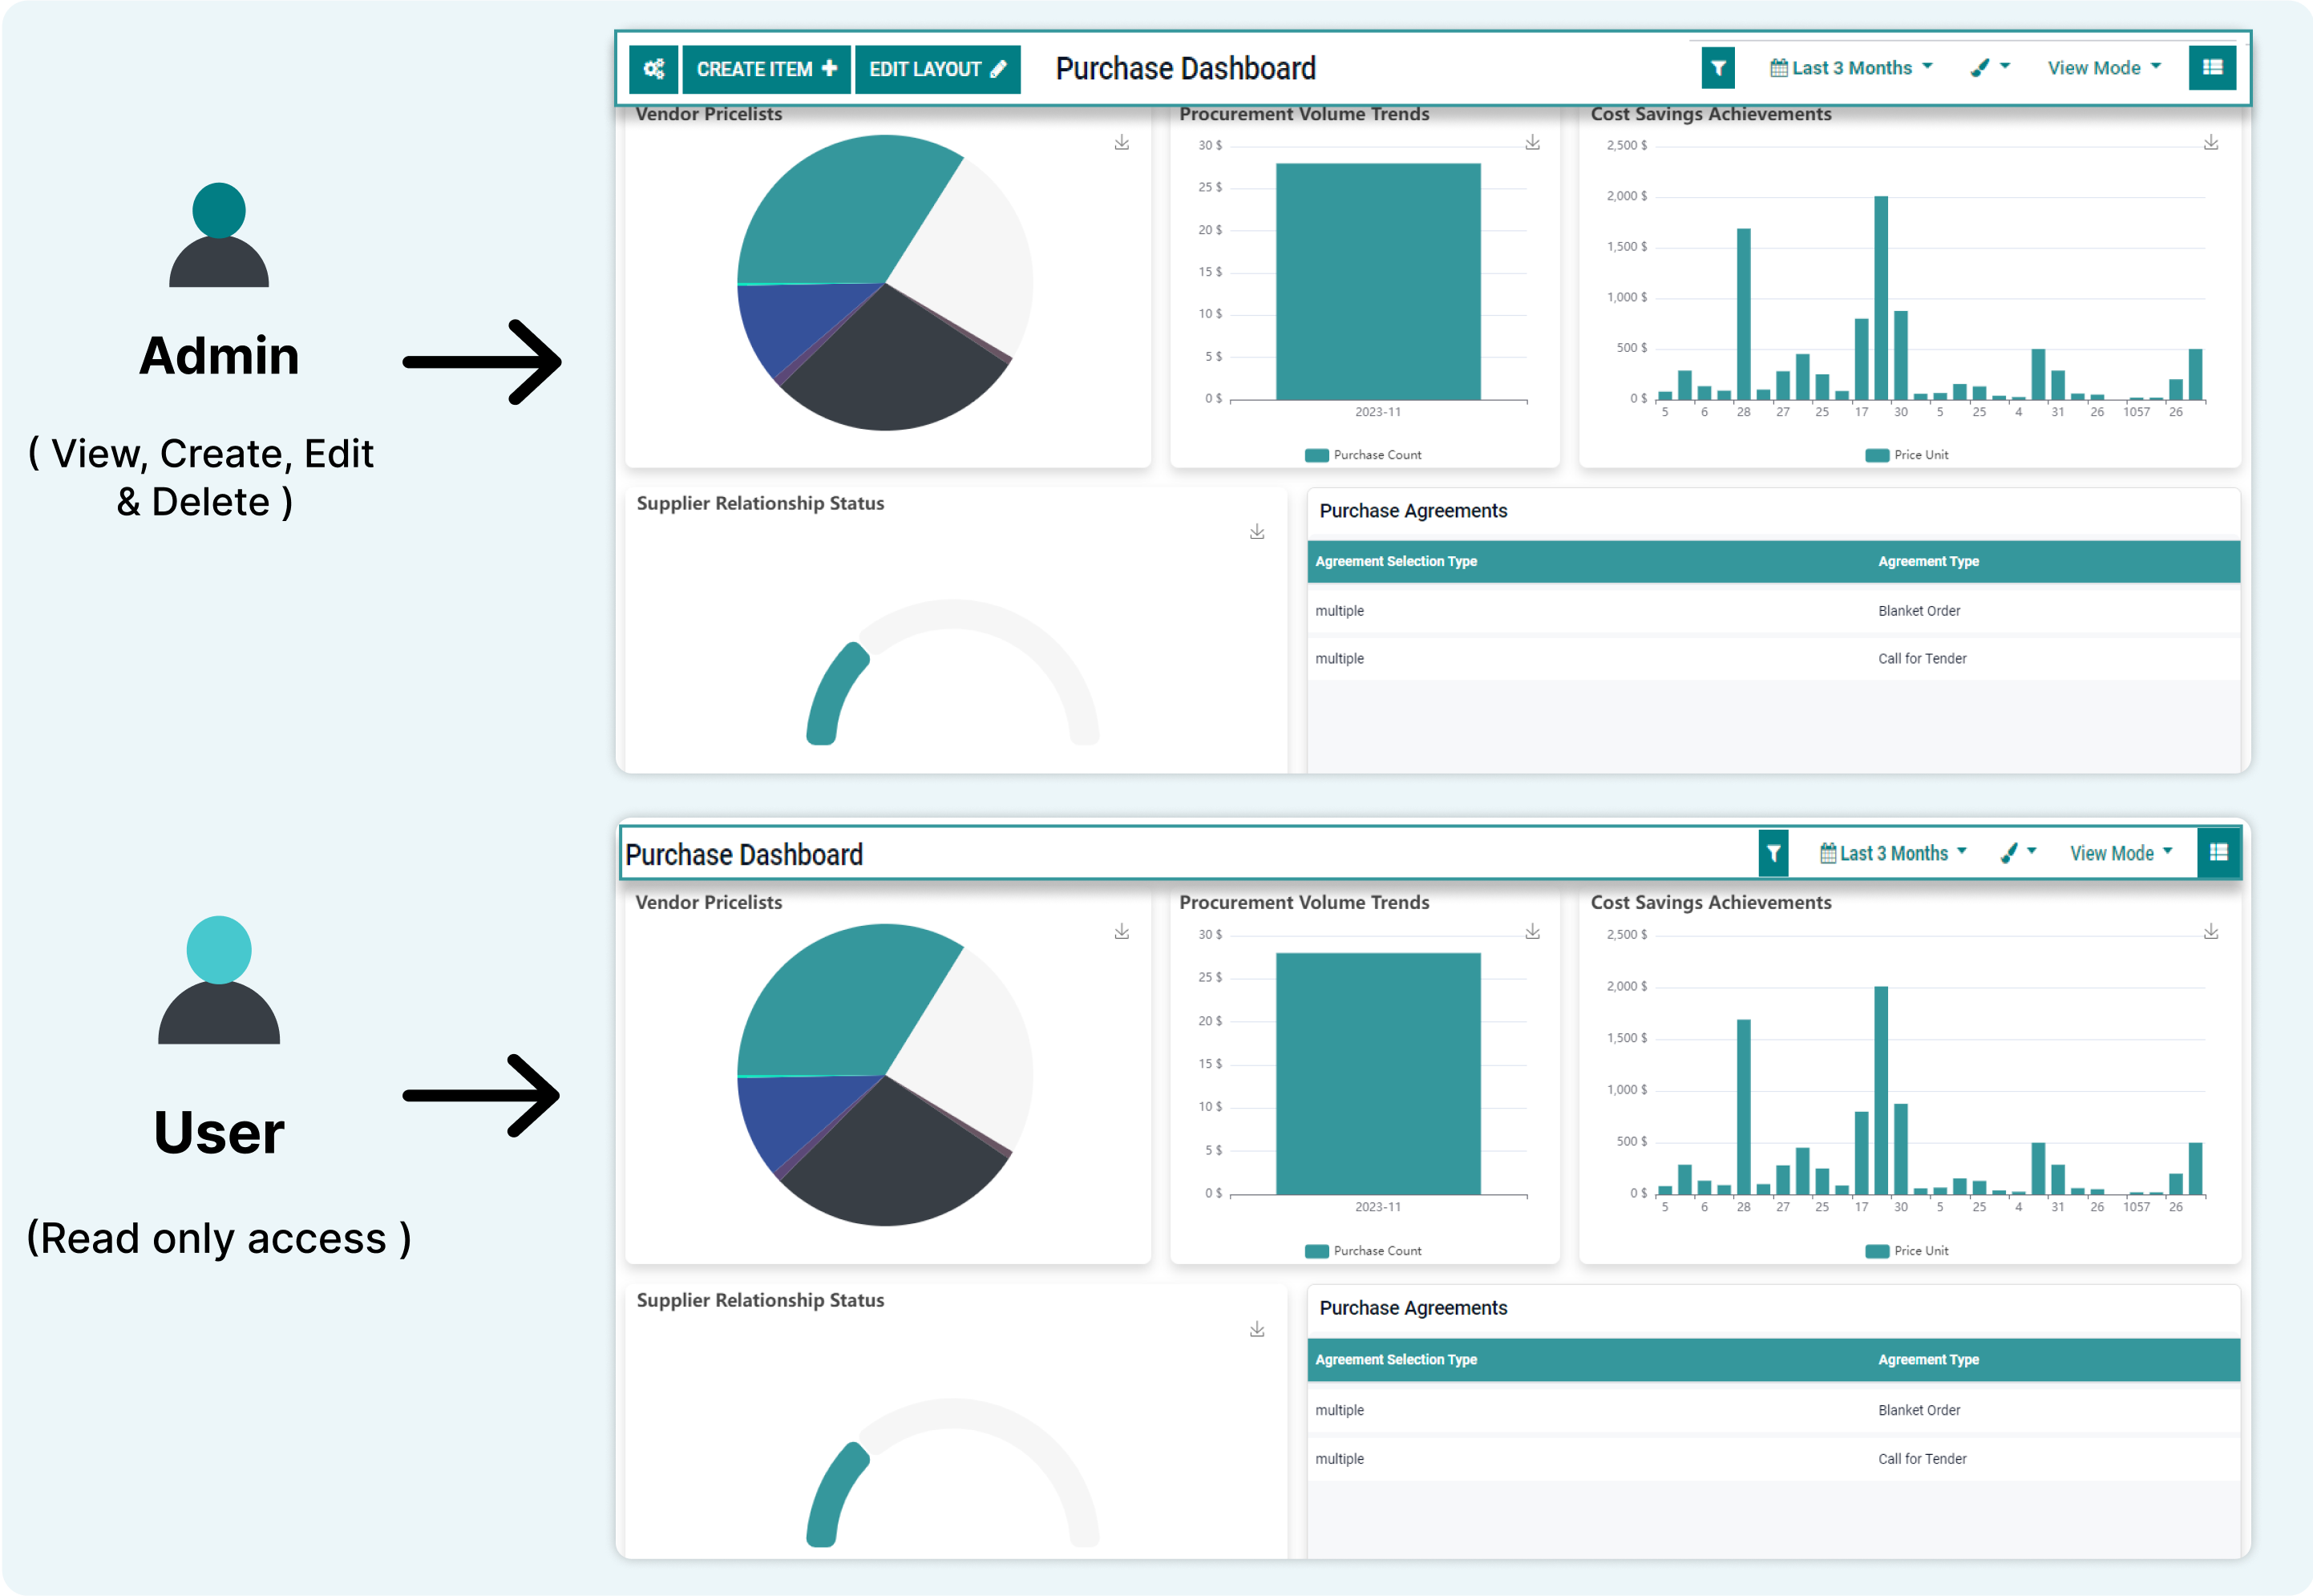
This example shows how you can create effortless access control with user groups.
-
Effortlessly manage user permissions by applying user groups, and granting read-only or full access to dashboards.
-
Whether collaborating with teams or sharing insights selectively, our streamlined access controls empower you to tailor data visibility, ensuring a secure and personalized dashboard experience for every user.
-
Click on the image to zoom in.
-
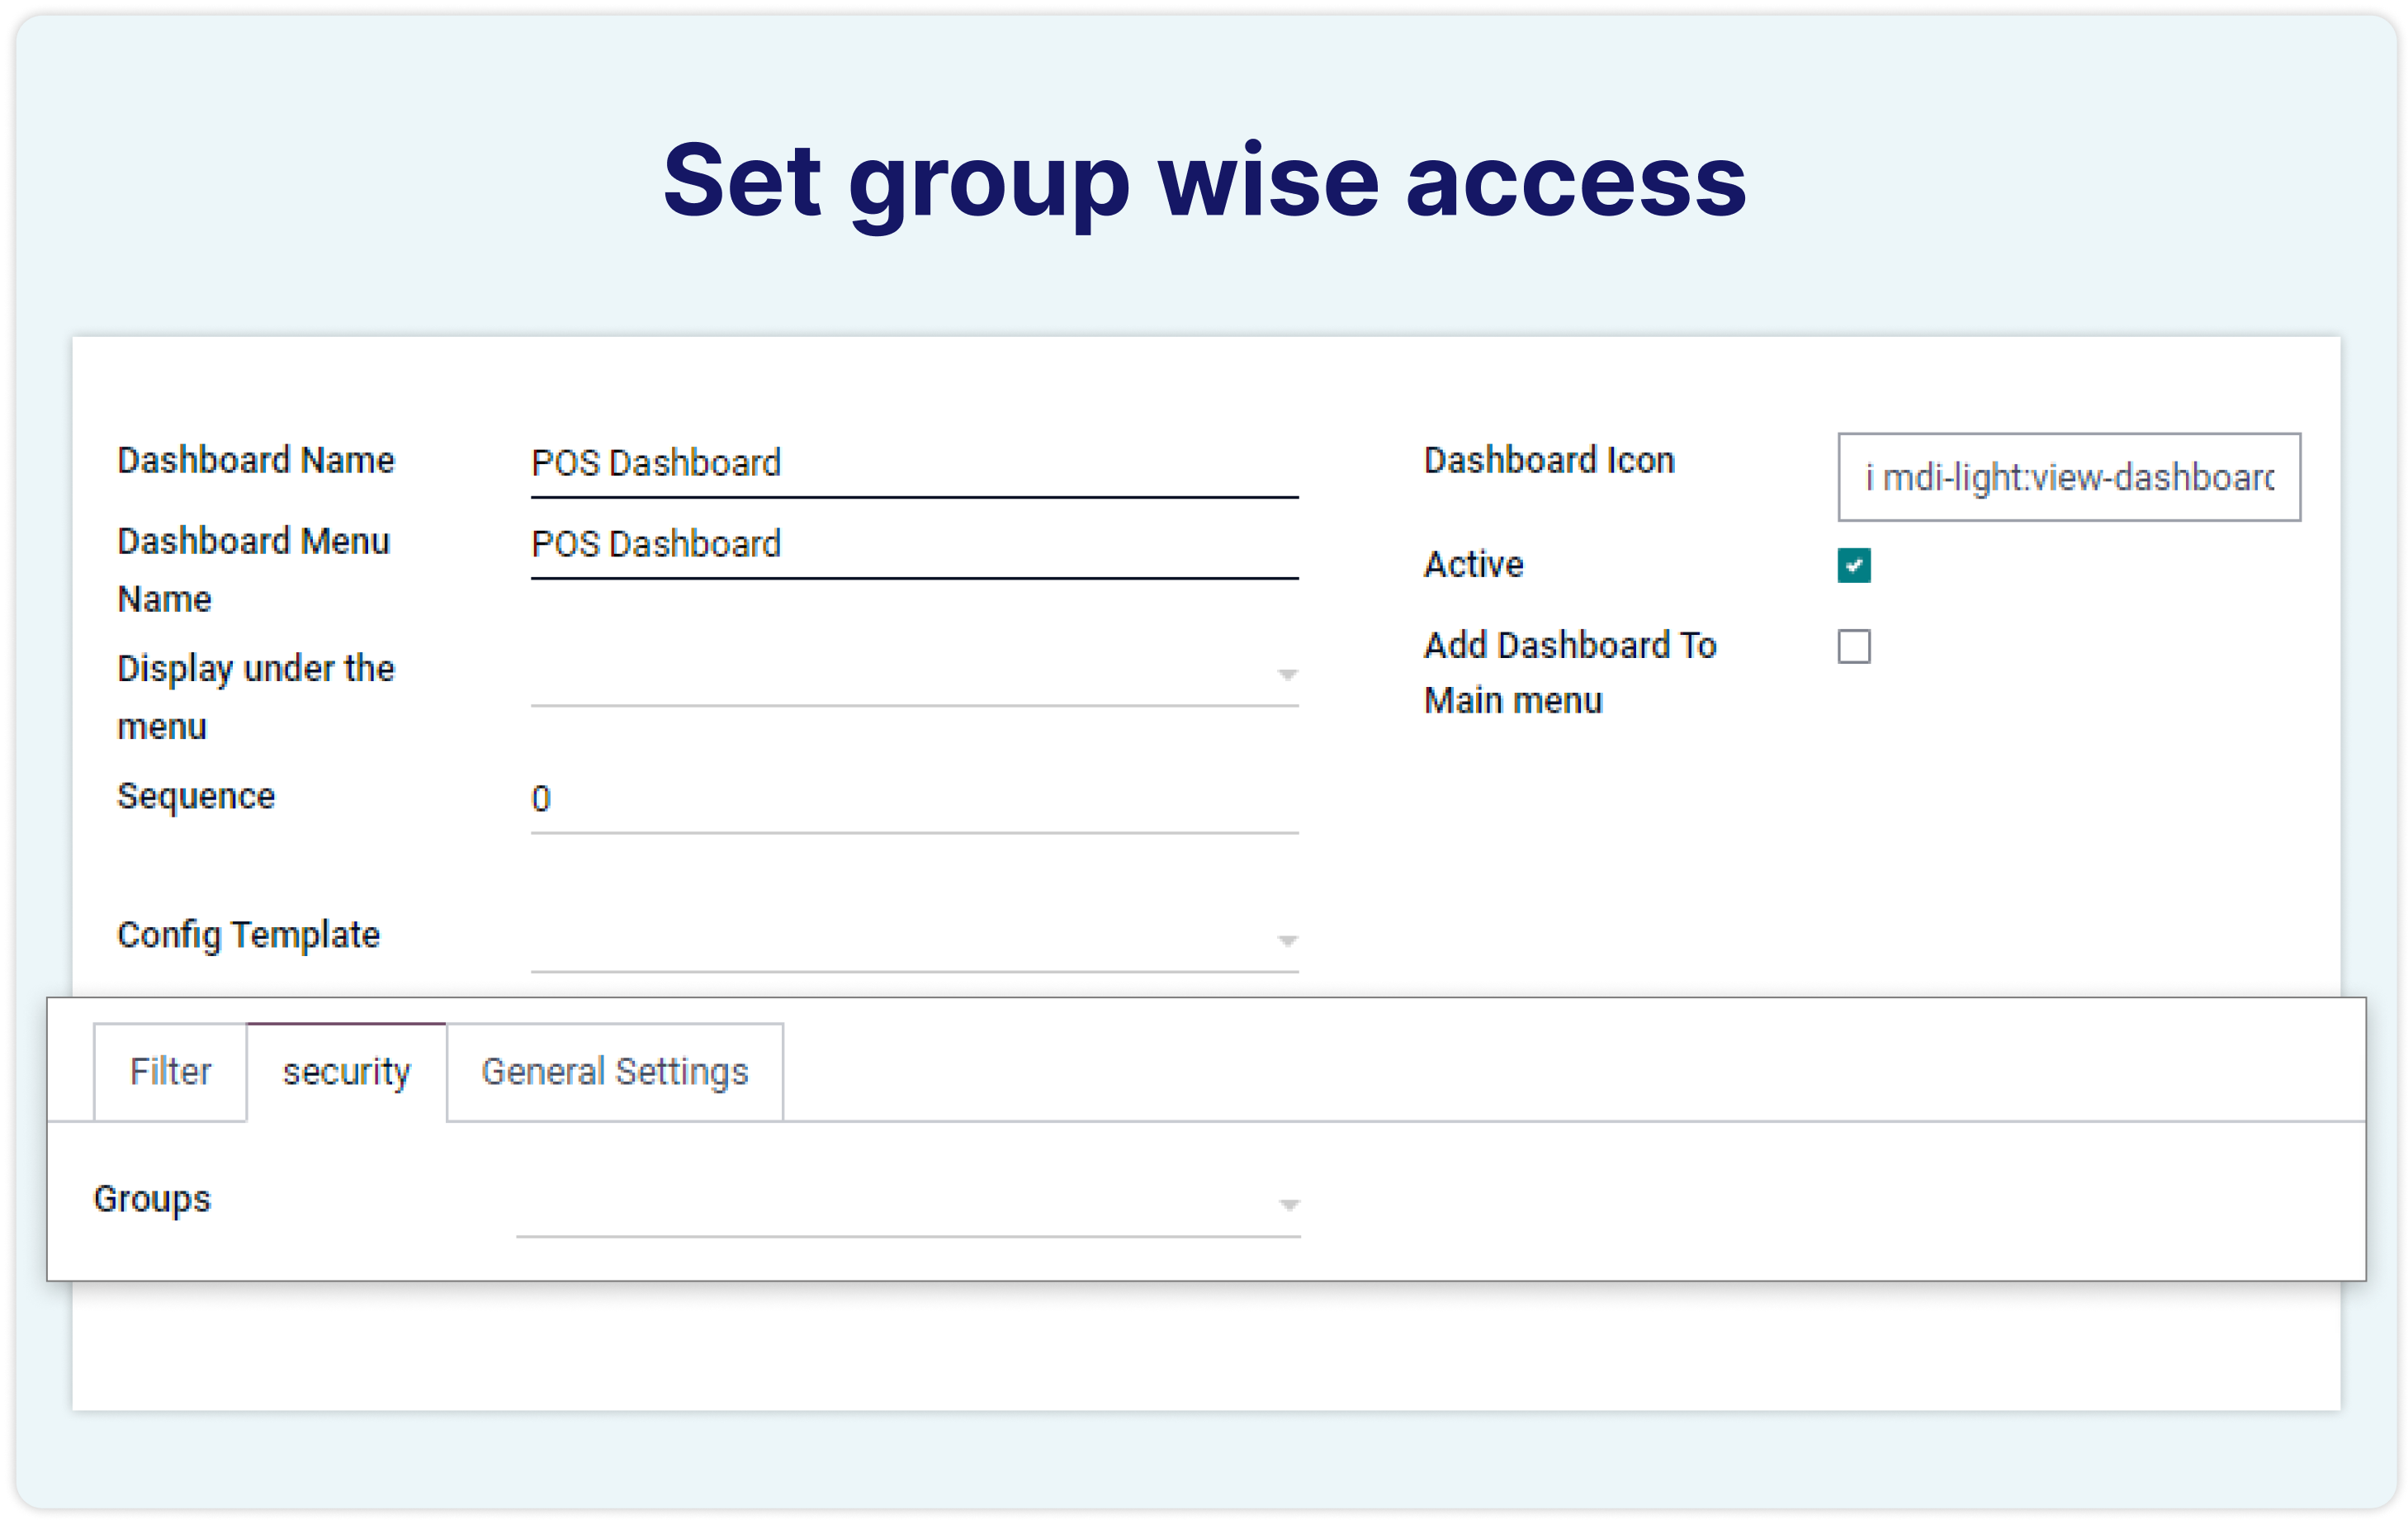
You can also set group wise access control in the dashboard.
-
Click on the image to zoom in.
-
You can also set read-only access in the dashboard.
-
Click on the image to zoom in.
Trend chart with stats values of selected entities.
You must have technical knowledge/technical person.
Not possible to create user-wise access rules.
Here is the solution
No need to have technical knowledge/technical person, Only you have to understand our module features.
Work in both Enterprise and Community versions(15,16,17).
Trend chart with stats values
Here we have explained an example step by step.
This example shows how you can create a trend chart with a stats values.
-
You can make trend chart which will show trend line and statistics of selected entities.
-
You can create a trend chart that not only displays the overall trend line and associated statistics but also presents the statistical values for selected entities at the bottom of the chart.
-
Click on the gif to zoom in.

Embed dashboard link on other websites.
You must have technical knowledge/technical person.
Not possible to create user-wise access rules.
Here is the solution
No need to have technical knowledge/technical person, Only you have to understand our module features.
Work in both Enterprise and Community versions(15,16,17).
Embed dashboard link.
Here we have explained an example step by step.
This example shows how you can create a trend chart with a stats values.
-
You can seamlessly integrate a customized dashboard into your website pages and blogs by generating the embedded dashboard content with a single click.
-
This feature allows you to effortlessly display real-time data visualizations and metrics directly on your web pages, enhancing user engagement and providing valuable insights at a glance.
-
Whether you're managing a blog or updating a webpage, the embedded dashboard ensures that your audience has access to up-to-date information in a visually appealing format.
-
The process is streamlined, it just requires a click to generate the necessary code and embed it, making it both efficient and user-friendly.
-
Click on the gif to zoom in.

Items on the dashboard can be moved and copied.
You must have technical knowledge/technical person.
Not possible to create user-wise access rules.
Here is the solution
No need to have technical knowledge/technical person, Only you have to understand our module features.
Work in both Enterprise and Community versions(15,16,17).
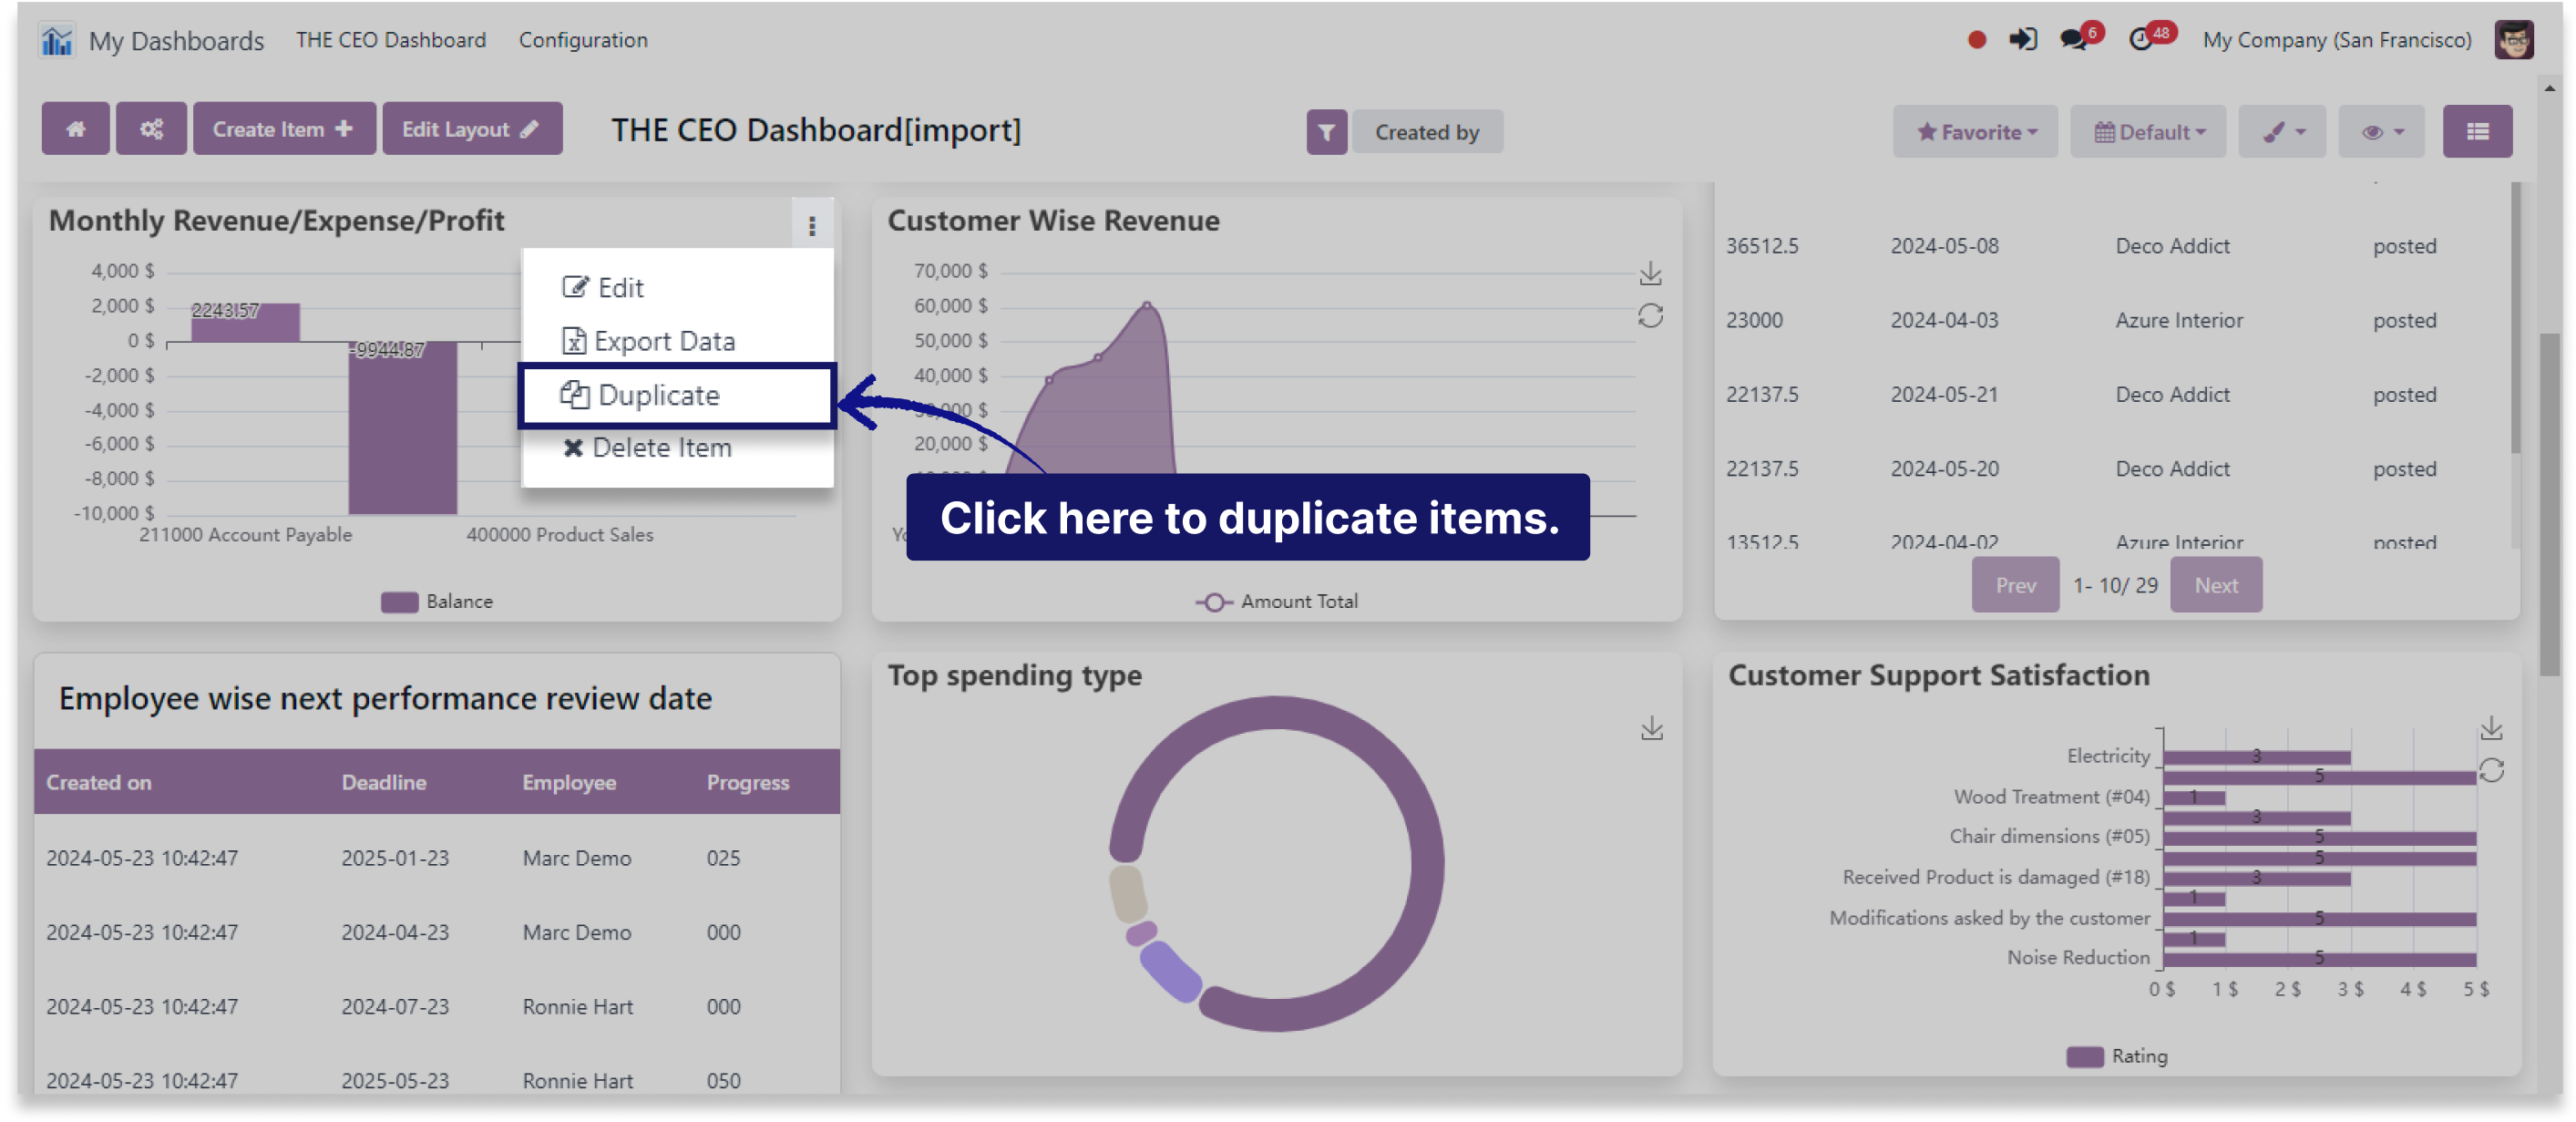
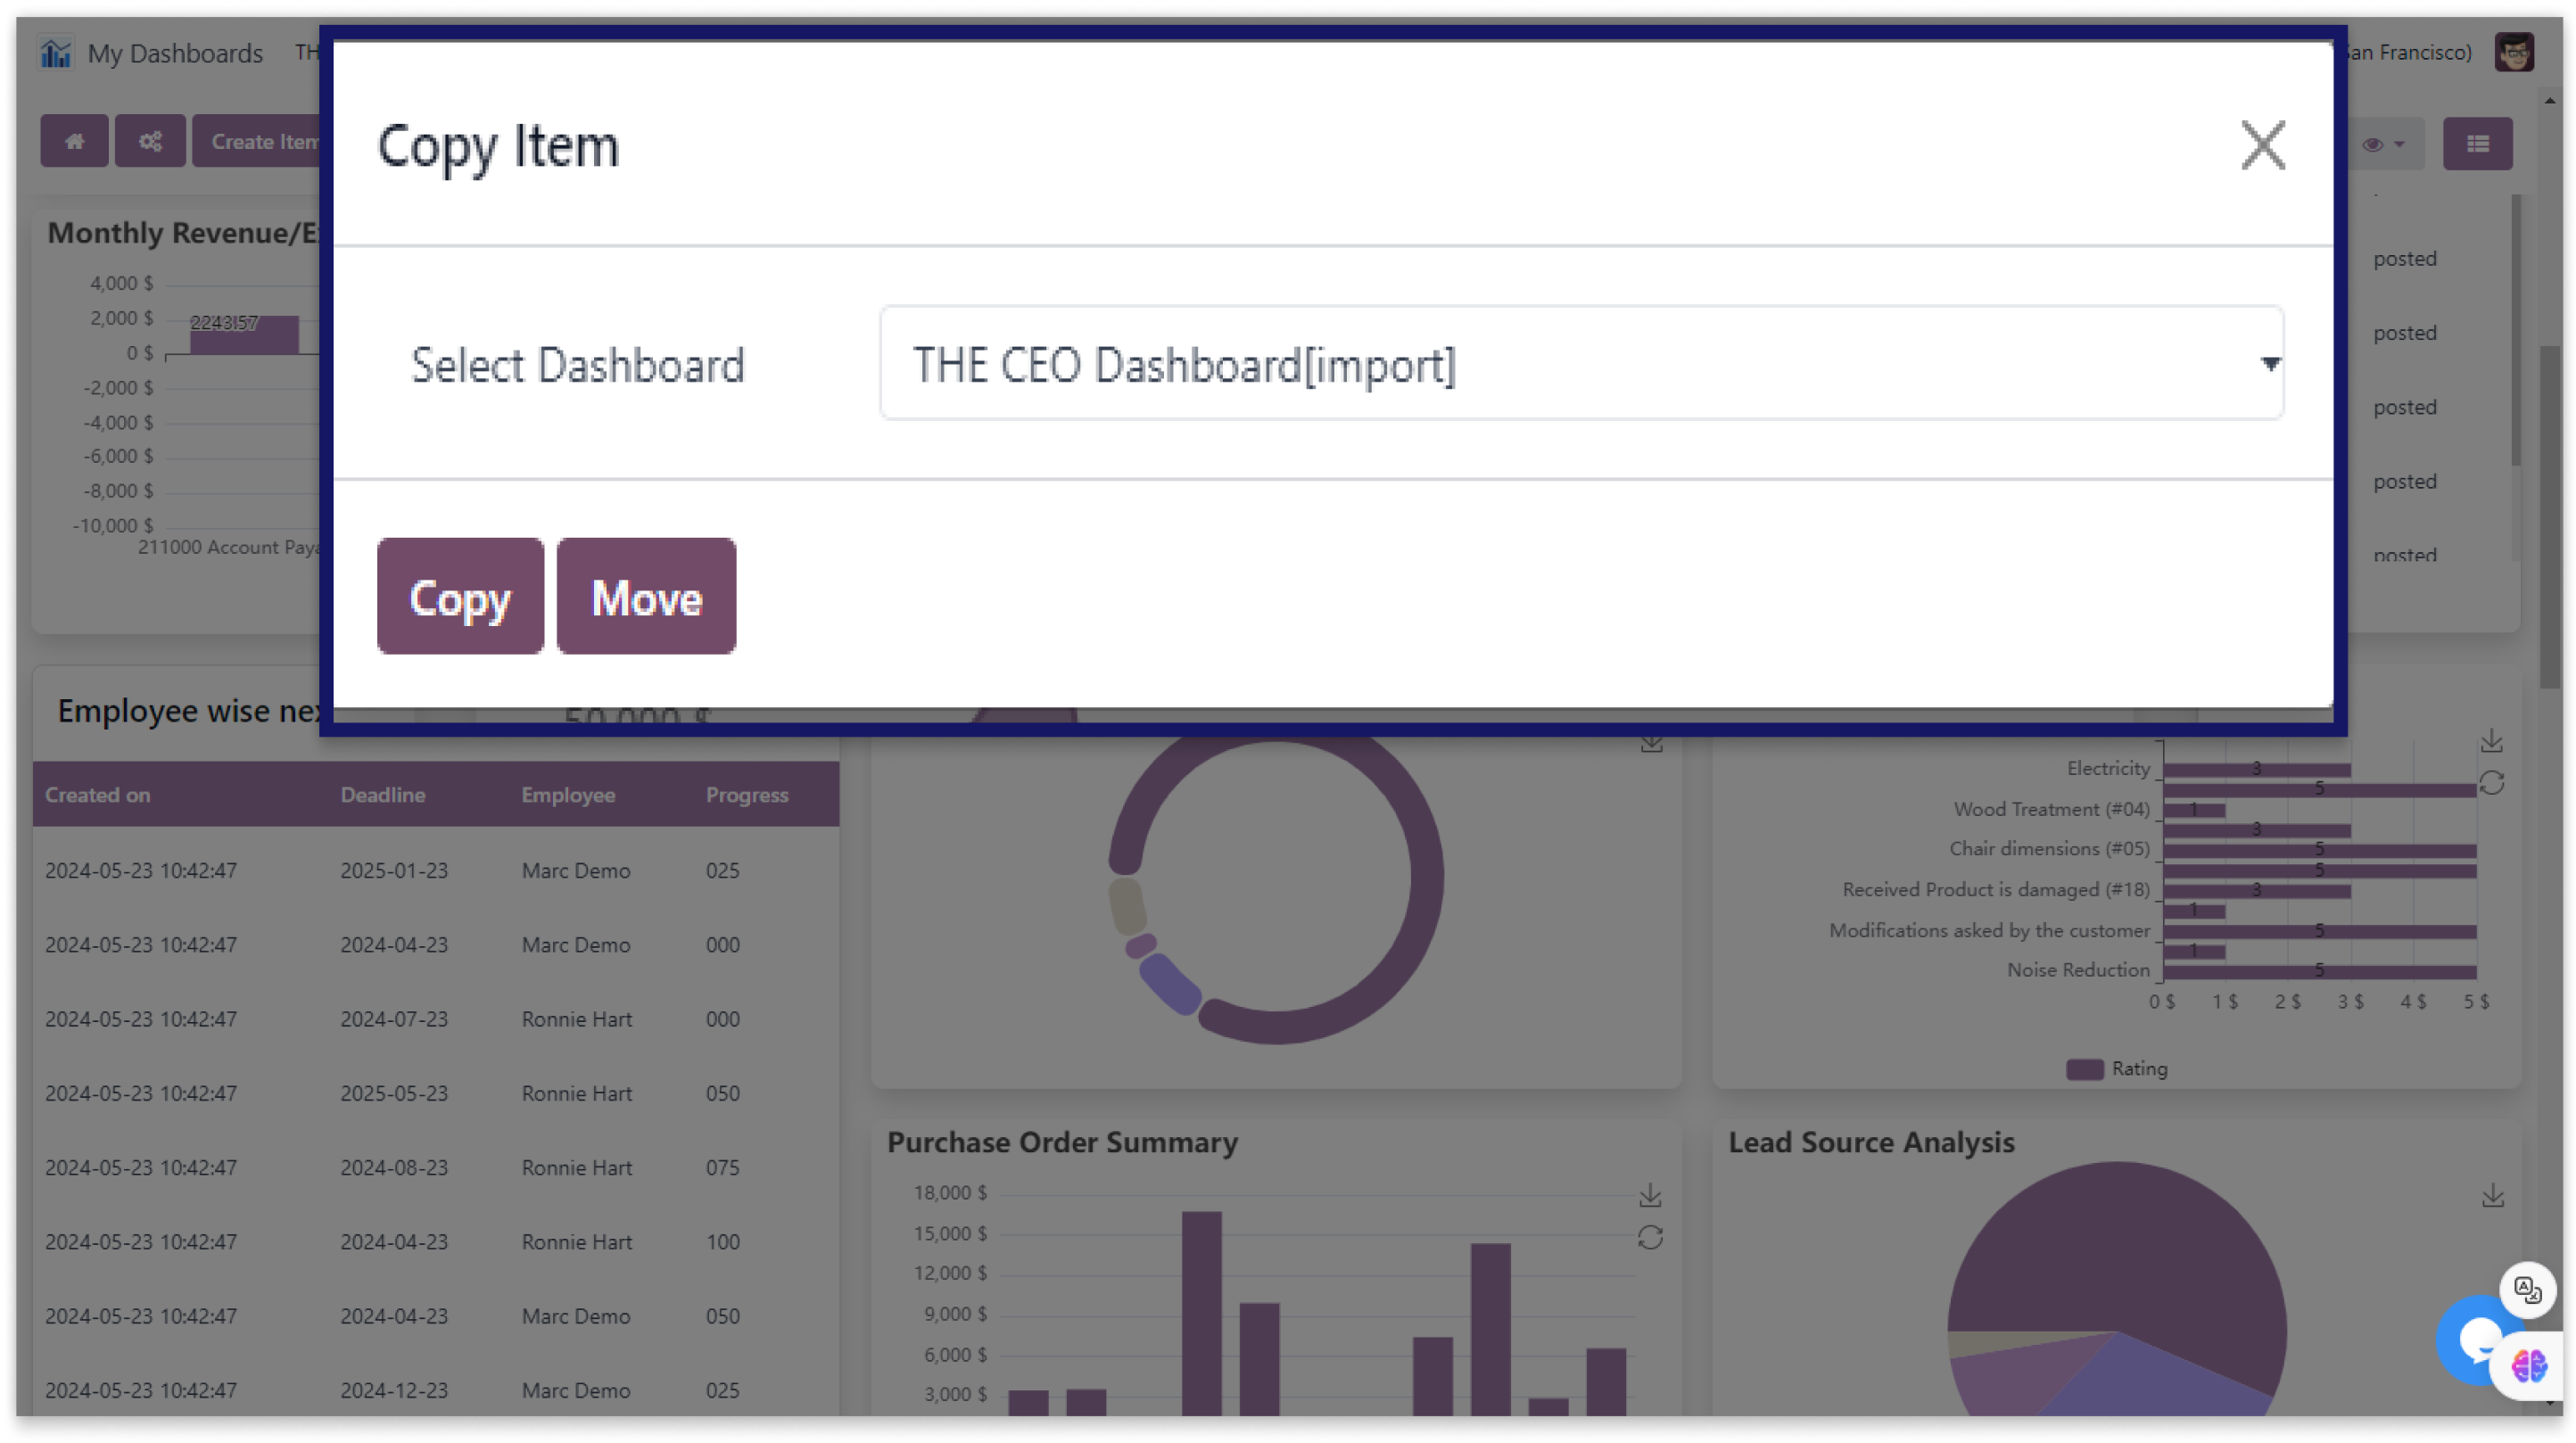
Move & copy dashboard items
Here we have explained an example step by step.
This example shows how you can copy/move object in dashboard.
-
Effortlessly re-arrange and duplicate items between dashboards, empowering you to tailor your data presentation dynamically.
-
Elevate your dashboard management with the freedom to move and copy items effortlessly.
-
Click on the image to zoom in.
Simple-to-measure data format selection.
You must have technical knowledge/technical person.
Not possible to create user-wise access rules.
Here is the solution
No need to have technical knowledge/technical person, Only you have to understand our module features.
Work in both Enterprise and Community versions(15,16,17).
Easy measure data format option
Here we have explained an example step by step.
This example shows you can copy/move object in dashboard.
-
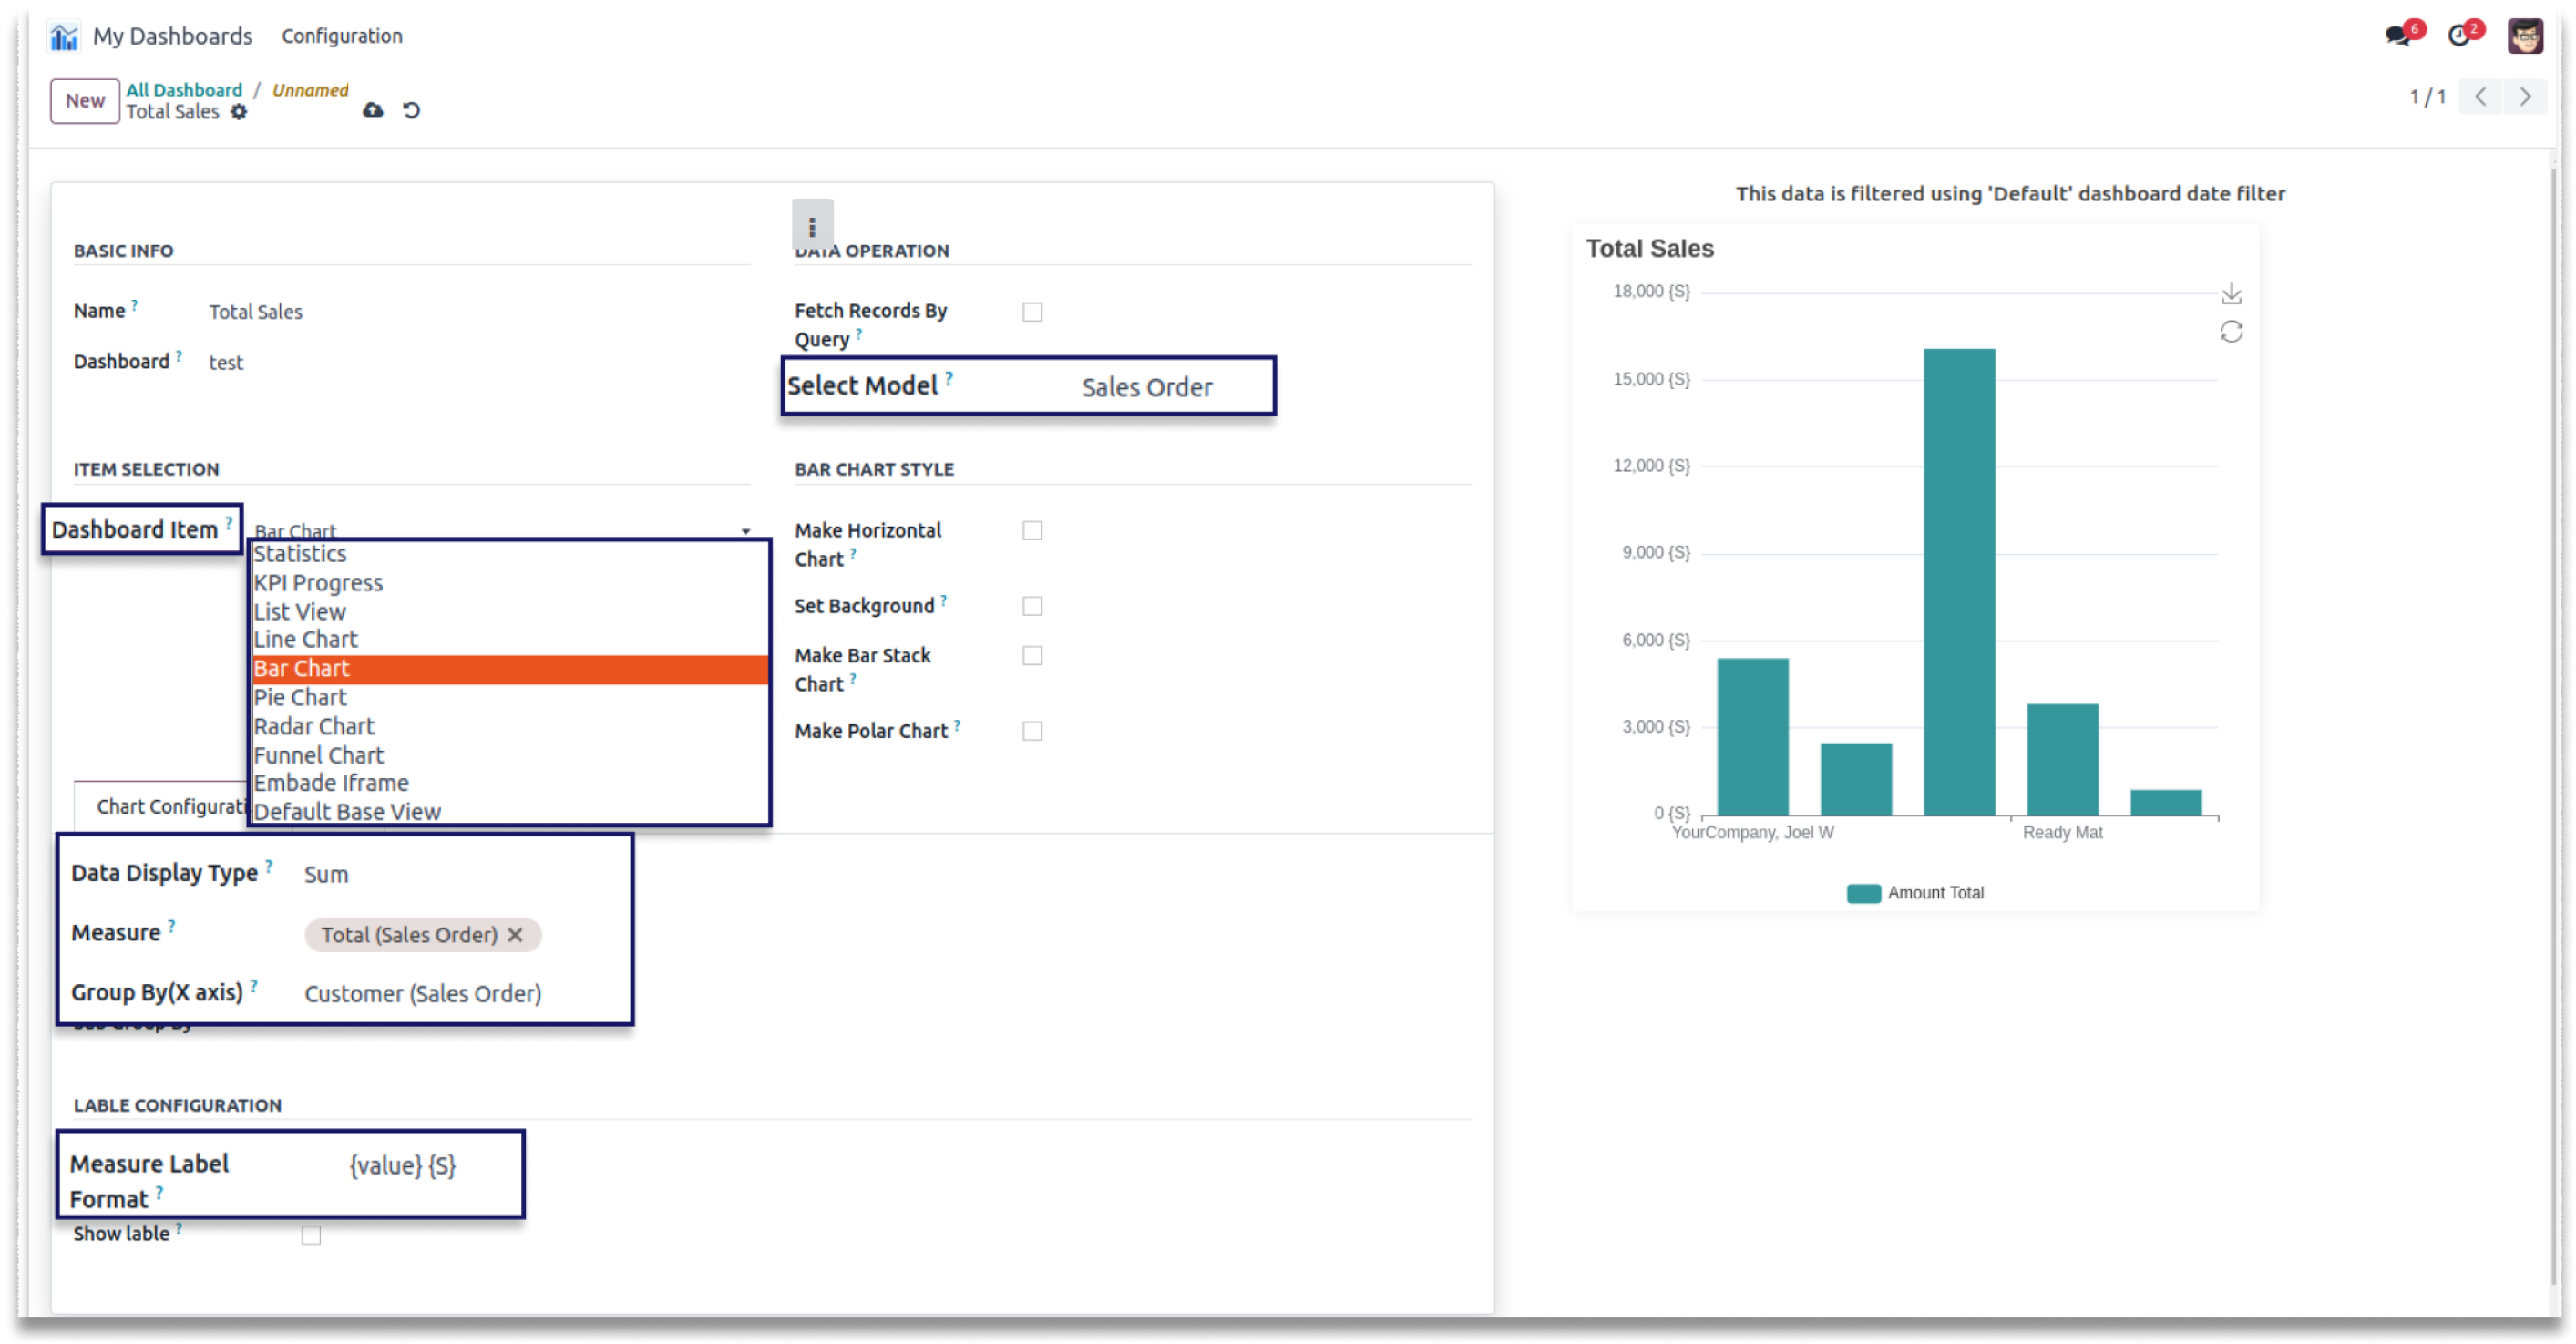
Fill the fields below with all the necessary information to generate a chart.
-
Choose the dashboard item you wish to generate after the information, then apply the chart configuration to fetch the data in a chart.
-
Group by feature allows you to retrieve multiple sets of data.
-
Add the details in the chart configuration to fetch the data from the selected model.
-
As seen in the screenshot below, you can modify the value of the x-axis and y-axis by modifying the value in the measure label format {value} {c}.
-
You can also specify the data's label.
-
"Default" date filter will be used to retrieve all the data.
-
Click on the image to zoom in.
-
In order to configure the chart, please watch the video.
-
Double click on the video to zoom in.
Customize the dashboard as per desired layout.
You must have technical knowledge/technical person.
Not possible to create user-wise access rules.
Here is the solution
No need to have technical knowledge/technical person, Only you have to understand our module features.
Work in both Enterprise and Community versions(15,16,17).
Editable dashboard layout
Here we have explained an example step by step.
This example shows how you can do customization and edit dashboard layout.
-
Personalize your dashboard layout to fit your preferences.
-
Customize and arrange your dashboard layout as desired.
-
Double click on the video to zoom in.
Distribute dashboards with PDF format.
You must have technical knowledge/technical person.
Not possible to create user-wise access rules.
Here is the solution
No need to have technical knowledge/technical person, Only you have to understand our module features.
Work in both Enterprise and Community versions(15,16,17).
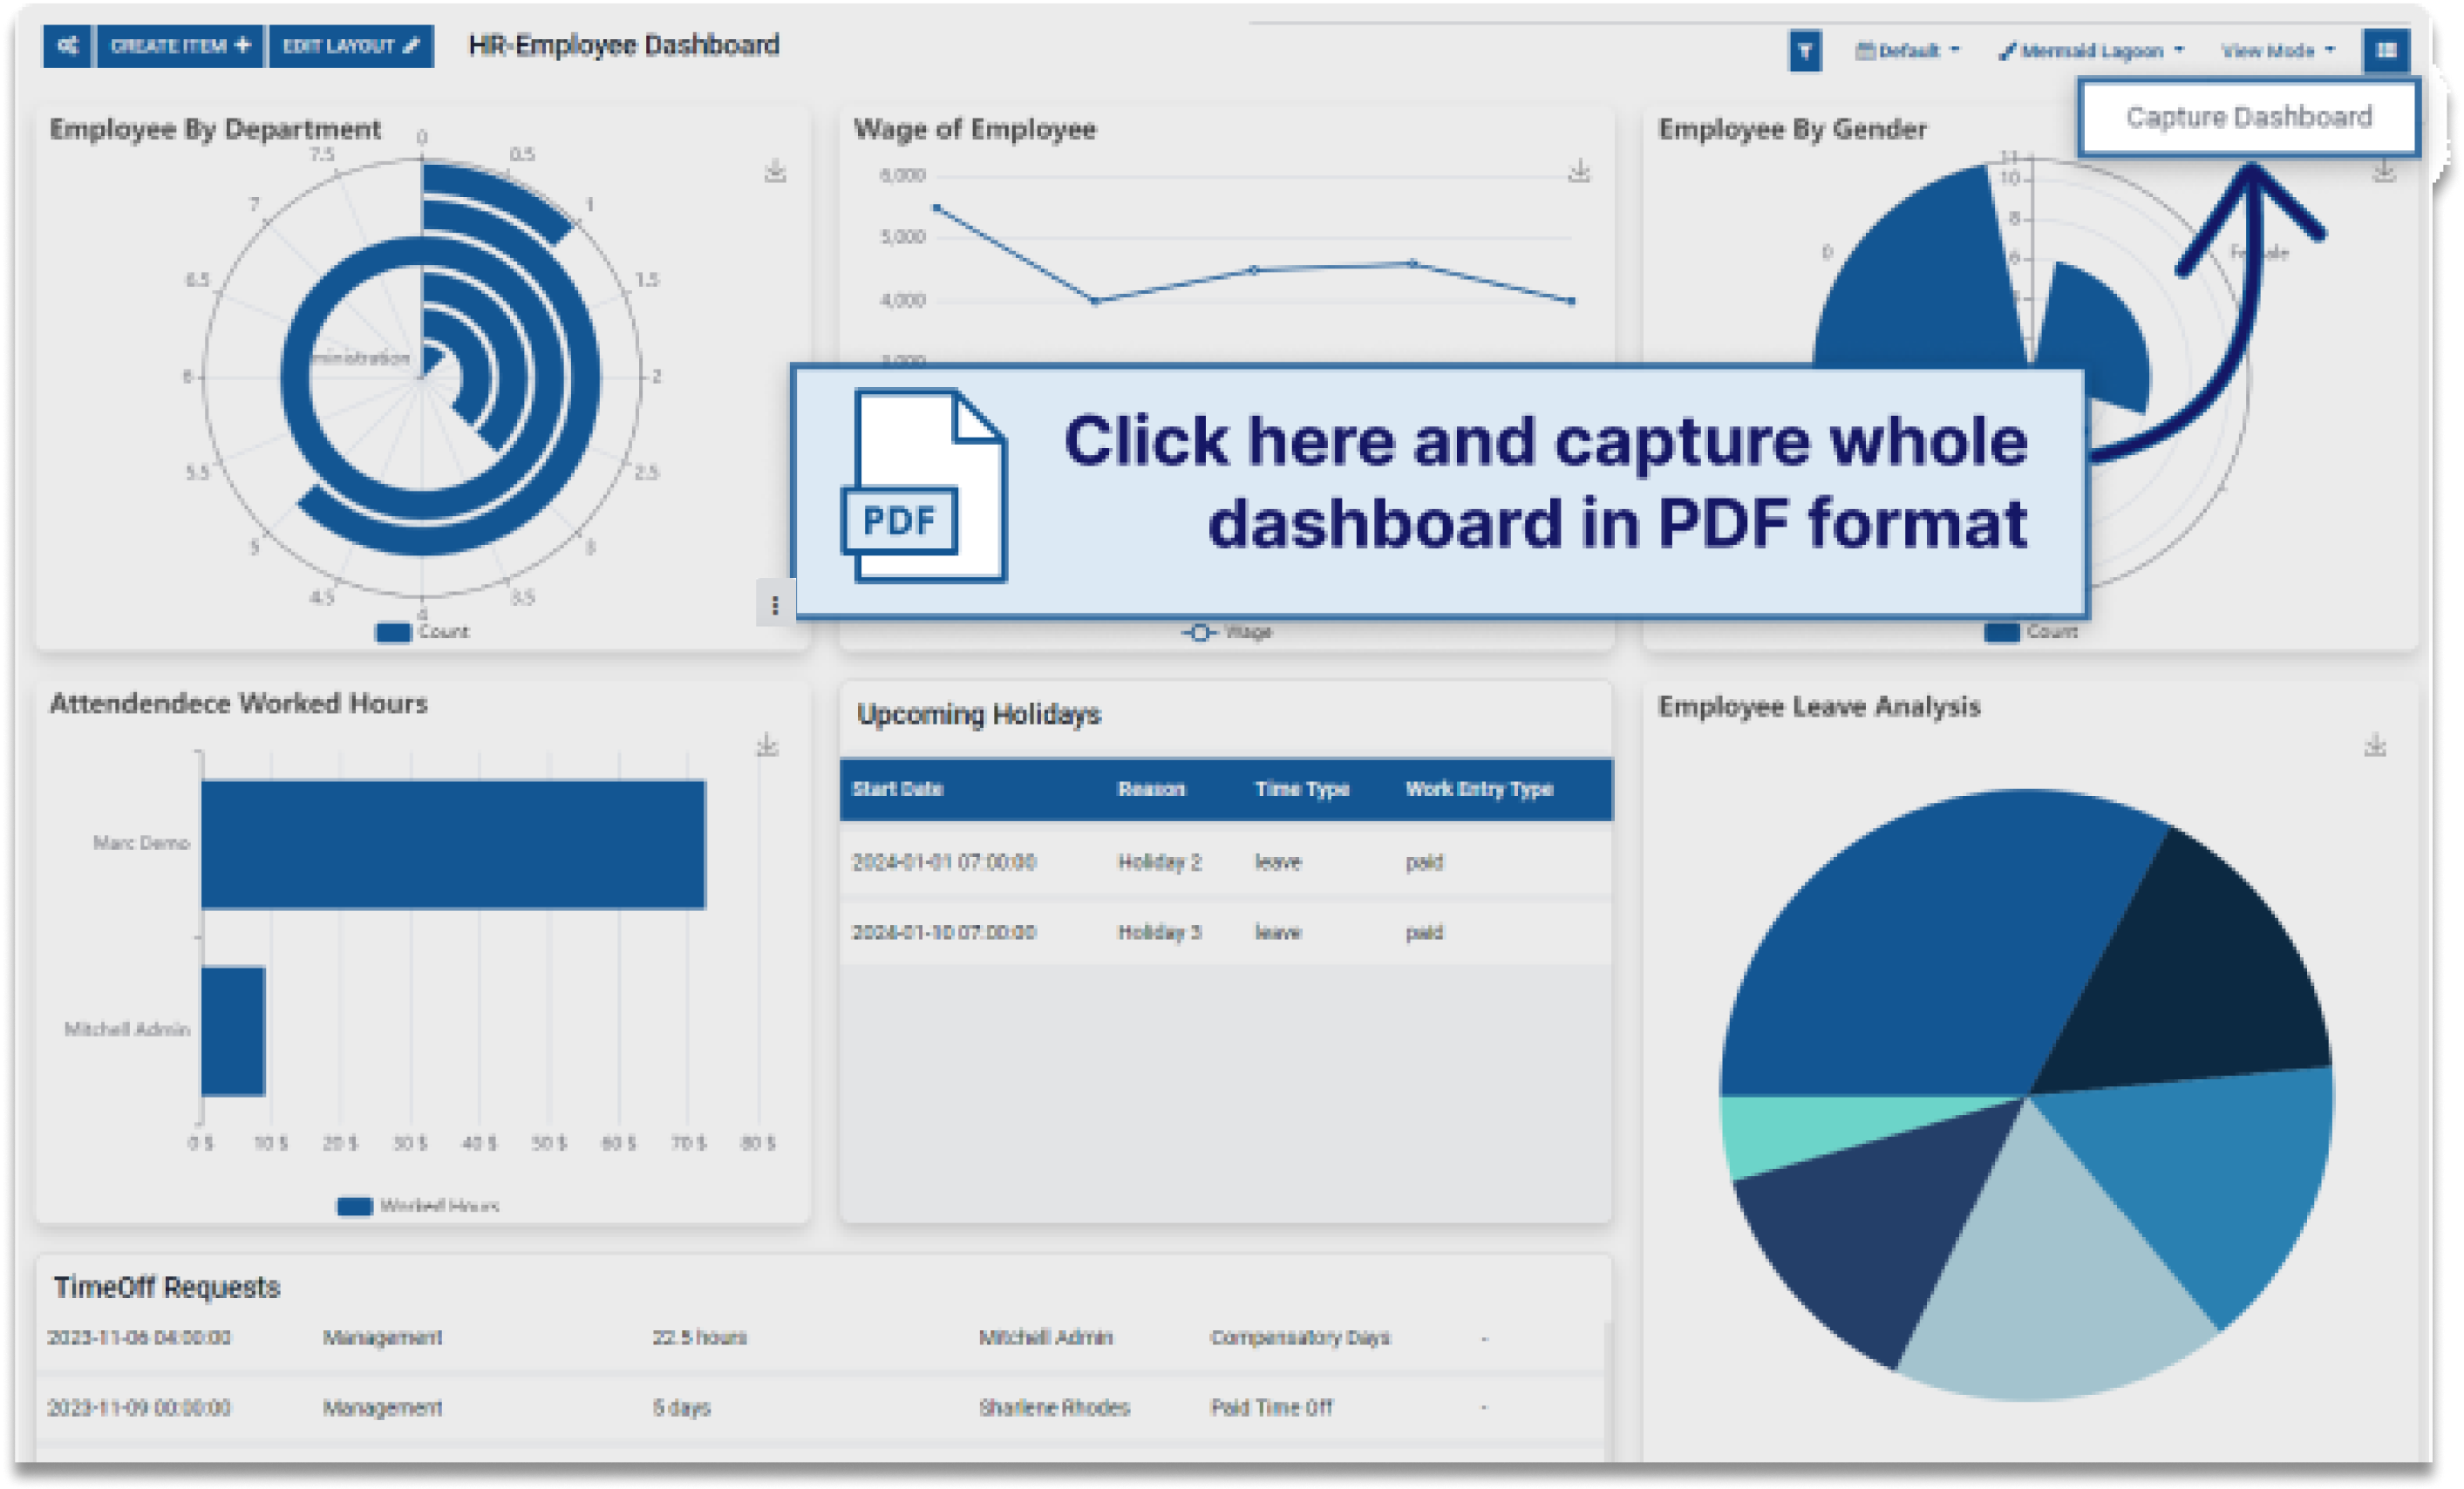
Download dashboard to PDF
Here we have explained an example step by step.
This example shows how you get dashboard in PDF format.
-
You can conveniently share your business statistics with customers and business groups by downloading your dashboard items and the entire dashboard in PDF format.
-
This functionality allows you to export your data and visualizations into a universally accessible file format, making it easy to distribute comprehensive reports and insights.
-
Whether you're presenting detailed analytics to stakeholders or providing regular updates to clients, PDF format ensures that your dashboard's layout, charts, and figures are preserved exactly as you designed them.
-
Click on the image to zoom in.
RTL interface compatibility.
You must have technical knowledge/technical person.
Not possible to create user-wise access rules.
Here is the solution
No need to have technical knowledge/technical person, Only you have to understand our module features.
Work in both Enterprise and Community versions(15,16,17).
RTL-Friendly Interface
Here we have explained an example step by step.
-
A RTL-friendly interface is designed to accommodate right-to-left (RTL) reading and writing patterns, which are essential for languages such as Arabic, Hebrew, and Persian
-
This type of interface adjusts the layout and alignment of text, menus, and other elements to align with RTL conventions, ensuring a natural and intuitive user experience for RTL language speakers.
-
This includes mirroring elements like navigation bars and ensuring that text and icons flow correctly, enhancing usability and readability for RTL users.
-
Click on the image to zoom in.